ABC Inventory Analysis Explained: How Retailers Prioritize Stock That Matters Most
A working operator's guide to running ABC analysis on your assortment. Sort by revenue, classify by tier, apply the right inventory policy to each class, and stop over-investing in items that do not deserve it.
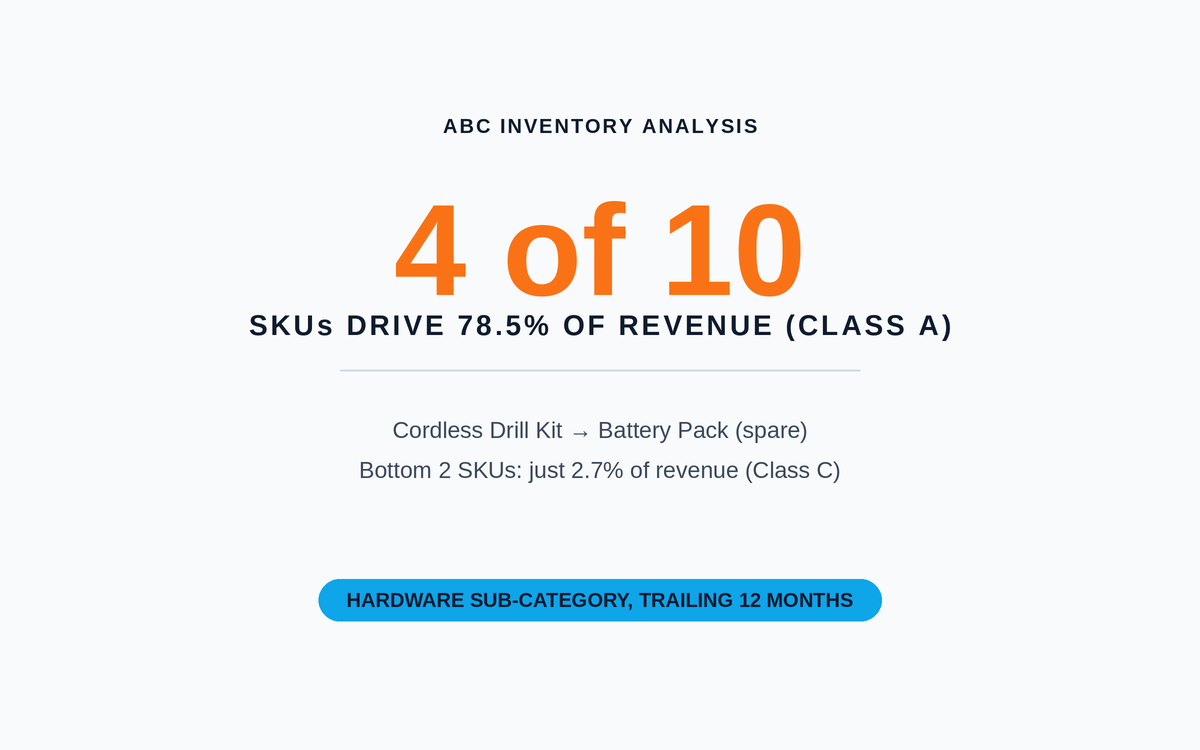
Table of contents+
A category manager pulls the quarterly revenue report and stares at 3,200 SKUs. Most of the revenue sits in the top 400. Half the assortment barely moves. The buyer knows this in her gut but cannot see it clearly enough to act. That is what ABC analysis fixes.
It is a simple technique. Sort SKUs by revenue contribution, look at cumulative share, and split the assortment into three tiers. A items are the vital few. B items are the useful middle. C items are the long tail. Once every SKU carries a class, the inventory decisions that used to feel like guesswork start writing themselves.
The steps come first, then a realistic worked example, then the mistakes that quietly cost retailers cash every quarter.
What is ABC analysis?
ABC analysis is a way to rank inventory items by how much they contribute to the business, then apply a different management policy to each rank. Most retailers use revenue as the ranking input. Some use gross profit. A few weight by strategic value.
The output is always the same shape: three buckets. A-class SKUs make up the top 70 to 80% of cumulative revenue. B-class covers the next 10 to 20%. C-class holds the bottom 5 to 10%. Different retailers pick slightly different splits. The exact thresholds matter less than applying them consistently.
The point of ABC is not to know which SKUs sell well. Everyone already knows the top five. The point is to see the tail clearly. Once the bottom 40% of the assortment is labelled C, decisions about safety stock, review cadence, and rationalization get easier fast.
The Pareto principle behind ABC
The observation that a small share of inputs drives most of the output shows up in almost every retail business. Vilfredo Pareto noticed it in Italian land ownership in the 1890s. Joseph Juran later applied it to quality management. Retail operators live with it every day: 20% of SKUs typically drive 70 to 80% of revenue, and 20% of customers usually deliver 60 to 80% of margin.
ABC analysis is just Pareto applied to inventory. The math is not magic and the split is not always exactly 80/20. What matters is the discipline of ranking, cutting the curve, and treating the tiers differently.
How to run ABC analysis in five steps
- Pull the last 12 months of SKU-level revenue from POS. Twelve months smooths out seasonality; anything shorter usually distorts the tail.
- Sort SKUs from highest revenue to lowest. Use total revenue, not average or per-transaction figures.
- Calculate cumulative revenue and cumulative percentage for each row.
- Assign class labels. Everything up to 80% cumulative is A. The next 15% is B. The last 5% is C. Adjust thresholds if the assortment behaves differently.
- Review the tiers with the category buyer and store operations. Flag any strategic exceptions (traffic drivers, loss leaders, brand-defining items) that deserve an override.
The math is straightforward enough to run in a spreadsheet or in the free ABC Analysis Calculator. For an assortment of a few hundred SKUs, the calculator is faster. For larger assortments or repeated monthly runs, use the Inventory Management Tracker (Excel) template, which keeps history alongside the classification.
A realistic worked example
A regional home improvement retailer runs ABC on a small hardware sub-category with 10 SKUs. Trailing 12-month revenue looks like this:
| Rank | SKU | Revenue | Share | Cumulative | Class |
|---|---|---|---|---|---|
| 1 | Cordless Drill Kit | $48,500 | 31.2% | 31.2% | A |
| 2 | Impact Driver 20V | $32,700 | 21.0% | 52.2% | A |
| 3 | Circular Saw | $24,100 | 15.5% | 67.7% | A |
| 4 | Battery Pack (spare) | $16,800 | 10.8% | 78.5% | A |
| 5 | Charger Standalone | $9,200 | 5.9% | 84.4% | B |
| 6 | Drill Bit Set | $7,300 | 4.7% | 89.1% | B |
| 7 | Blade Assortment | $5,100 | 3.3% | 92.4% | B |
| 8 | Safety Glasses | $3,600 | 2.3% | 94.7% | B |
| 9 | Work Gloves | $2,400 | 1.5% | 96.2% | C |
| 10 | Hardware Fastener Kit | $1,900 | 1.2% | 97.4% | C |
Total category revenue: $155,600. Four A-class SKUs deliver 78.5% of the category. Six SKUs make up the rest.
The classification is now doing the work. The buyer knows the four A-class items deserve tight replenishment, generous safety stock, and weekly review. The four B items get monthly attention. The two C items are candidates for reduced buffer or, in the next assortment review, possible discontinuation.
Setting inventory policy by class
Once every SKU carries a class, the policy decisions follow a pattern. This is where ABC starts paying back the time it takes to run.
| Class | Service level target | Safety stock | Review cadence | Replenishment approach |
|---|---|---|---|---|
| A | 97 to 99% | Generous. Compute statistically using demand and lead-time variability. | Weekly | Automated with tight monitoring. Personal buyer attention. |
| B | 92 to 95% | Moderate. Simple max-average formula is usually enough. | Monthly | Automated with exception-based review. |
| C | 85 to 90% | Lean. Days-of-supply rule of thumb is often fine. | Quarterly | Fully automated. Rationalization pass every 12 months. |
For A-class SKUs, compute safety stock using the statistical formula with a target service level. For C-class SKUs, a simpler rule works because the cost of over-buffering a tail item is small compared to the cost of running the same math across thousands of SKUs.
Common ABC analysis mistakes
1. Running ABC once and then forgetting
Category performance shifts. Trends move. A new product launch reshapes the mix. Any ABC classification older than one quarter is a suspect classification. Fast-moving or trend-driven categories such as apparel and consumer electronics deserve a monthly refresh.
2. Ignoring strategic overrides
The math will put a signature traffic-driver in class C if its revenue is low. That does not mean the item should be treated like a C item. Loss leaders, brand-anchor SKUs, and items that pull baskets deserve manual promotion to A regardless of what the calculator says. ABC is a starting point, not a verdict.
3. Using ABC to rank whole categories, not individual SKUs
The value of ABC comes from SKU-level granularity. Rolling up to category level hides the exact tail that most needs attention. Always run ABC at the SKU or style-colour-size level, then aggregate up if needed for reporting.
4. Applying the same service level across A, B, and C
This is the most expensive mistake in the whole discipline. Differentiating service levels by ABC class typically releases 15 to 30% of inventory dollars without moving aggregate service level. If every SKU is at 98%, safety stock is bloated by definition.
5. Choosing revenue when profit is the right lens
In categories where margin varies dramatically, revenue-weighted ABC misclassifies. A high-revenue, low-margin SKU can be less strategic than a lower-revenue, high-margin one. When the assortment has wide margin variance, run ABC on gross profit or run both and compare. The Gross Margin Calculator helps compute the profit input.
A simple decision framework
When any inventory question comes up, three checks answer most of it.
Check 1: What class is this SKU?
- A: apply the strictest math. Compute statistical safety stock. Review weekly. Tight replenishment.
- B: use simpler rules. Monthly review. Exception-based buying.
- C: rely on defaults. Quarterly review. Automate everything. Prune when appropriate.
Check 2: Is there a strategic reason to override?
- Yes: flag the SKU and promote it manually.
- No: let the classification carry the policy.
Check 3: When was ABC last run?
- Within the last quarter: proceed with confidence.
- Older: rerun before making any big buy or markdown decision.
Next steps
Start with the 20 to 50 SKUs in one category. Get the workflow right there before rolling it out to the rest of the assortment.
- Run the classification on your own data using the ABC Analysis Calculator.
- Set service levels and safety stock per class using the Safety Stock Calculation Guide.
- Automate replenishment triggers with the Reorder Point Calculator.
- Compare your post-ABC inventory turnover against Inventory Turnover Benchmarks by Industry to see if the tiering is working.
Frequently Asked Questions
What is the difference between ABC analysis and Pareto analysis?+
They are the same idea applied at different granularities. Pareto is the underlying observation that a small share of inputs drives most of the output. ABC is Pareto applied specifically to inventory, with the tail split into two tiers (B and C) instead of one. In practice, retail teams use the terms interchangeably.
How many SKUs do I need before ABC is useful?+
ABC starts paying back around 50 SKUs. Below that the eyeball test is faster. Above a few hundred SKUs, ABC becomes essential because no buyer can hold the full assortment in their head. The ABC Analysis Calculator handles up to a few thousand rows comfortably.
Should I run ABC on revenue, profit, or units sold?+
Revenue is the default and works for most retail categories. Gross profit is better where margin varies widely. Units sold is useful for planning shelf space, warehouse slotting, or picking labor. Many mature retailers run all three, one for pricing decisions, one for inventory decisions, one for operations.
How does ABC classification change reorder points and EOQ?+
A-class SKUs get tighter reorder points and carefully tuned EOQ because the cost of getting them wrong is high. C-class SKUs use simpler rules-of-thumb because the fine-tuning cost outweighs the savings.
Can an SKU move classes over time?+
Yes, and this is one of the main reasons to rerun ABC quarterly. A new product launch, a competitor price move, a viral trend, a supplier failure. Any of these can push a B item into A or drop an A into C. Log the class in the SKU master and review changes as part of the quarterly business review.
What about seasonal SKUs?+
Run ABC using trailing 12-month revenue so seasonal items get a fair rank. During peak season, a seasonal SKU can look like an A item on a trailing 3-month view but sit in B or C on the annual view. Use the annual view for classification and the seasonal view for tactical planning.
Is ABC the same as XYZ analysis?+
No. ABC ranks by revenue contribution. XYZ ranks by demand variability. Advanced planners combine them into a 3x3 matrix (AX, AY, AZ, BX, and so on) to identify high-revenue high-volatility items that need extra attention. Start with ABC alone. Layer XYZ once the ABC discipline is stable.
What is a realistic outcome from implementing ABC properly?+
Most retailers who move from a single service-level policy to ABC-differentiated service levels release 15 to 30% of the inventory cash they had locked up in buffer without moving aggregate service level. The gains show up in inventory turnover improving within one quarter and free cash flow expanding within two.
Related Calculators
Try the math from this guide with our free tools.
ABC Analysis Calculator
Paste a list of SKUs and their revenue and get an instant A / B / C classification. Use the output to set service levels, safety stock, and buying priority the way experienced planners do.
Open calculator
Inventory Turnover Calculator
Measure how many times a year your average inventory sells through and gets replaced. The single most consequential operational KPI in retail. It connects buying decisions, warehouse cash, markdown risk, and finance targets into one number. The turn ratio arrives converted into days and weeks of supply, together with the working capital a one-turn improvement would release. Departments that carry stock at retail value rather than cost usually track it with a retail inventory method tracking template, which produces the same average-inventory figure this calculator needs.
Open calculator
Reorder Point Calculator
Set the trigger level that fires the next PO for an SKU. Reorder point combines expected demand during lead time with a buffer for the weeks that run hot. Get either half wrong and you either stock out or bury cash on the shelf. Outputs are the ROP itself, the lead-time demand behind it, the buffer as a percent of expected demand, and the days of supply that ROP represents at current sales velocity.
Open calculator
Related Articles

Reorder Point Formula: The Operator's Guide to When to Reorder
How buyers and DC planners actually set reorder points. The formula, three what-if scenarios, service-level math by ABC class, continuous vs periodic review, and the four mistakes that turn a good ROP into a stockout machine.
Safety Stock Calculation: The Complete Operator’s Guide
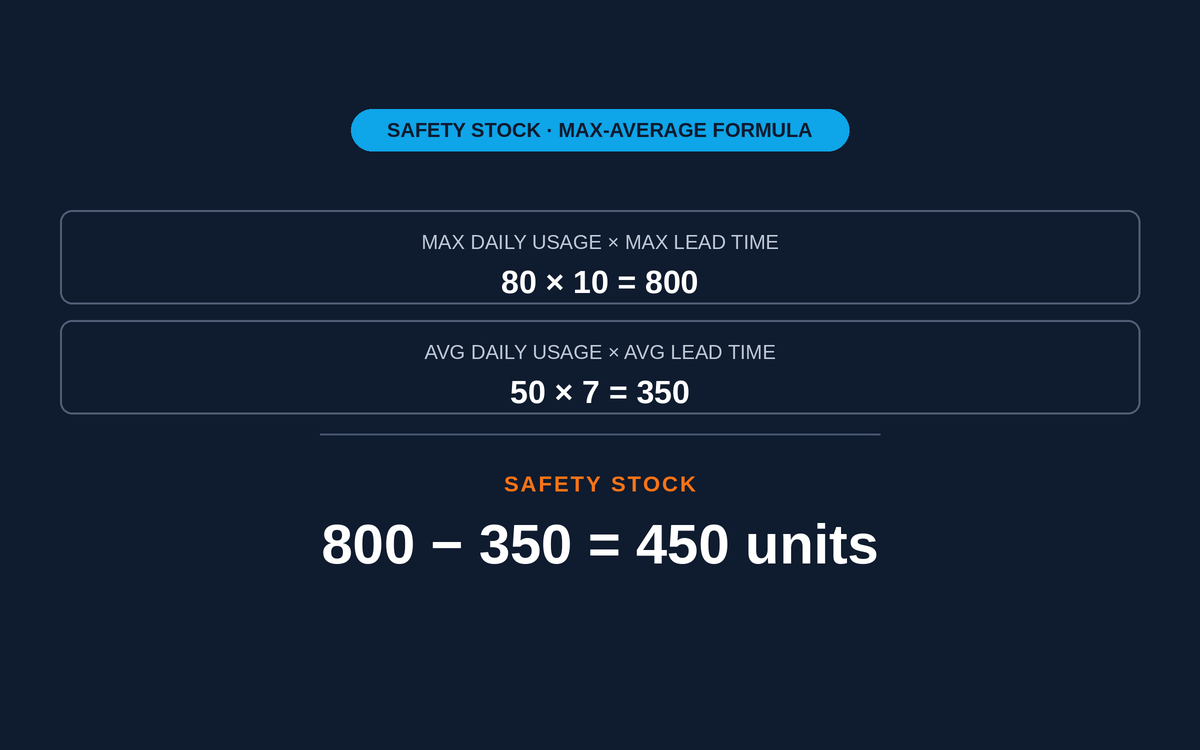
How experienced retail planners actually size safety stock. Two formulas, a Z-score reference table, and the operational habits that keep the number honest.
EOQ Formula Explained: Economic Order Quantity for Retail Operators
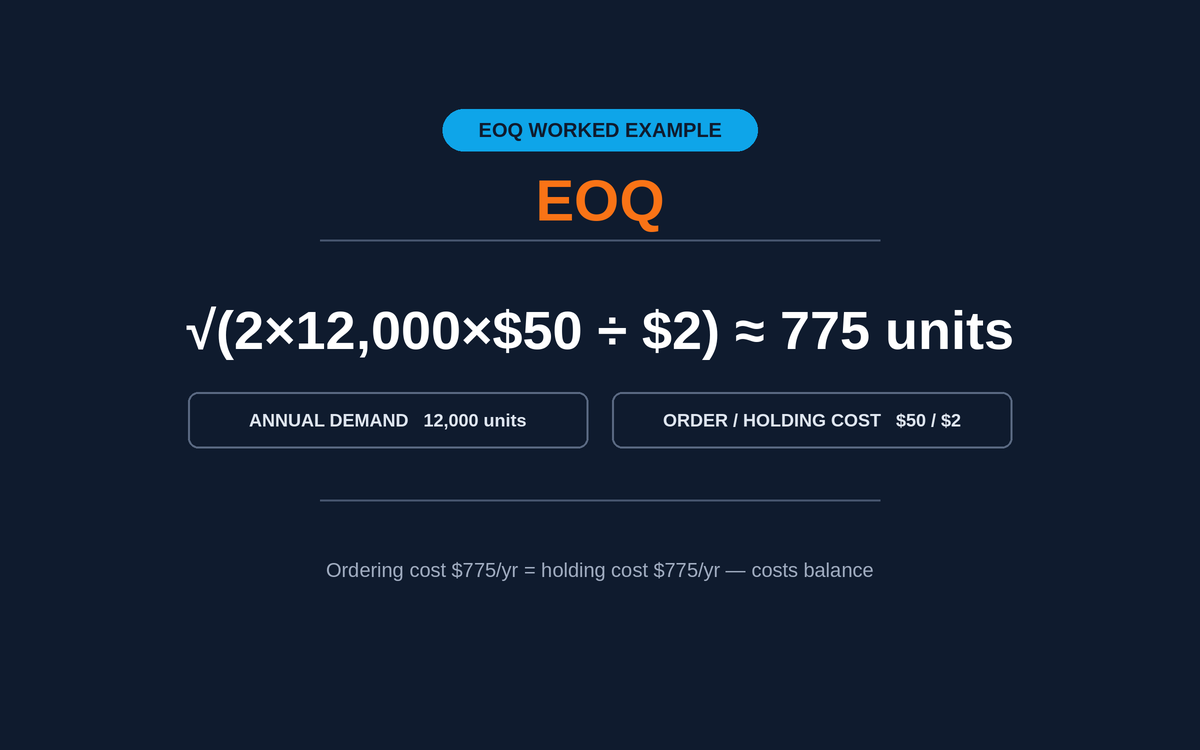
How buyers actually use Economic Order Quantity. Two formulas, a full worked example, sensitivity scenarios, and the assumptions that decide whether EOQ helps or misleads on a given SKU.
Explore Related Resources
Handpicked benchmarks, templates and guides to help you dig deeper.