Retail KPI Templates
Retail KPI Formulas in Excel
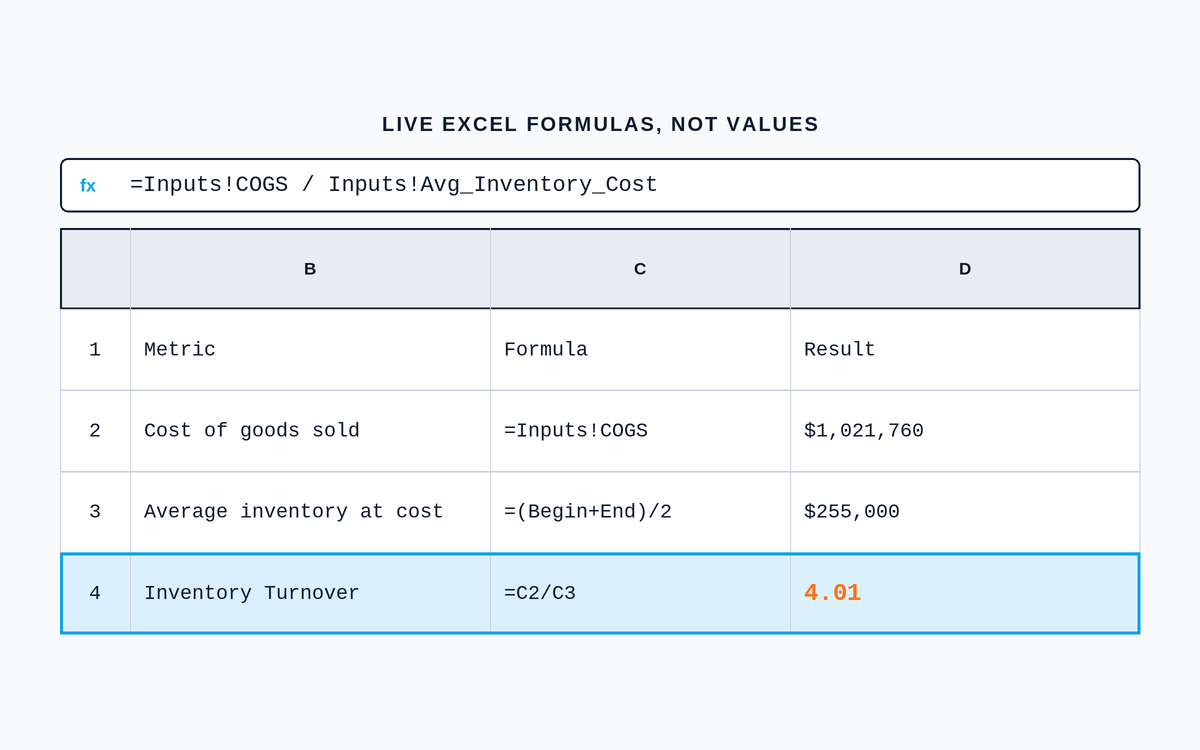
Twenty-one retail KPI formulas as live Excel cells, with a separate input sheet and sample store data pre-filled, so the workbook computes the moment you open it and every formula is visible rather than hardcoded.
Enter your name and email. Your download starts immediately.
No credit card. No spam. Unsubscribe anytime.
About this template
Twenty-one retail KPI formulas as live Excel cells, with a separate input sheet and sample store data pre-filled, so the workbook computes the moment you open it and every formula is visible rather than hardcoded.
What's included
- All 21 KPI formulas as live cells, none hardcoded as a typed value
- Input sheet separate from the calculation sheet, so nothing overwrites a formula
- Sample store data pre-filled, so it computes on open
- A Match column that checks every row against the published worked example
- GMROI decomposed into its margin factor and its turnover factor
- Instructions sheet first, with the Google Sheets import route
- No macros and no VBA, so it opens in Excel and Google Sheets alike
Related Calculators
GMROI Calculator
The single most honest cross-category profitability metric in retail. GMROI answers one question: for every dollar of inventory you funded, how many dollars of gross profit did you get back? A high gross margin on inventory that never sells produces zero return, which is why GMROI keeps margin and inventory turnover honest against each other. The output is the GMROI ratio with gross margin percent, inventory turnover, gross profit and a plain-English performance band, because the ratio on its own tells a buyer very little.
Gross Margin Calculator
The cleanest read on how much of every sales dollar you actually keep after paying for the goods. Gross margin drives every downstream financial decision in retail: what to price, what to promote, what to keep on the shelf. Margin percent, the markup equivalent, cost as a percent of revenue and the price-to-cost multiplier all appear together, which is what it takes to translate between the three lenses without reaching for a second tool. The COGS input behind all of it depends on how inventory is valued in the first place, and a retailer using the retail inventory method will get a different COGS figure than one costing at actual unit cost, even from identical sales and purchase data.
Markup Calculator
Set a selling price from cost or reverse-engineer the markup baked into an existing price. Markup is the buyer’s language of pricing (percent added on top of cost), while margin is the finance language (percent kept from revenue). Alongside markup percent come profit per unit, the margin equivalent and the price-to-cost multiplier. Buying and finance can then argue about the price rather than about the denominator. Departments already running the retail inventory method calculator have a cost-to-retail ratio on hand, which doubles as a fast sanity check against the markup this page returns.
Inventory Turnover Calculator
Measure how many times a year your average inventory sells through and gets replaced. The single most consequential operational KPI in retail. It connects buying decisions, warehouse cash, markdown risk, and finance targets into one number. The turn ratio arrives converted into days and weeks of supply, together with the working capital a one-turn improvement would release. Departments that carry stock at retail value rather than cost usually track it with a retail inventory method tracking template, which produces the same average-inventory figure this calculator needs.
Sell-Through Rate Calculator
The speed-of-sale metric every buyer, planner and category manager reads before touching pricing or reorder decisions. Sell-through rate measures the percent of received units that actually sold across the measurement window. High sell-through means the buy is working. Low sell-through means the inventory is aging faster than expected and the markdown clock is running. Enter units sold and units received and the STR percent arrives next to remaining units, weekly sell rate, and projected weeks to both 80 percent and 100 percent sell-through, with a plain-English band saying whether the buy is on pace. The point of the band is to be acted on, not filed.
Markdown Calculator
The pricing tool every buyer and merchandiser reaches for when inventory is running behind sell-through pace. Out comes the markdown amount, the markdown percent, the final selling price, and, once a cost is entered, the resulting gross profit and margin percent. It also flags whether the markdown depth is promotional, seasonal, aggressive or clearance-tier, and generates practical next-step recommendations tied to gross margin, GMROI, sell-through rate and inventory turnover. A markdown also changes the inventory value carried under the retail inventory method, so it is worth re-checking that ratio after a significant markdown event rather than waiting for the next period close.
Related Articles
Margin vs Markup in Retail Math
A buyer and a controller report different margins on the same category and both are right. Where the two conventions came from, which metrics mislead and when, and how to decide which number has authority.
The Retail KPI Guide: 18 Metrics Every Store Should Track
A practical reference of the 18 retail KPIs that actually move the business, with formulas, benchmarks, and how to use each one.
GMROI Explained: The Cornerstone Profitability Metric for Retail Buyers
The most honest profitability metric in retail. How buyers and category managers actually use GMROI to make cross-category assortment, pricing and open-to-buy decisions.
Inventory Turnover Explained: Formula, Benchmarks and How to Actually Move It
How retail operators actually work the turnover ratio. The formula, the cost-versus-sales trap, three what-if scenarios, category benchmarks, the seven levers that move turn, and the guardrails that keep higher turn from becoming lost sales.
Related Templates
Retail KPI Dashboard (Excel)
A weekly KPI dashboard for store managers and district leaders. Drop in raw weekly numbers and the workbook fills in 12 KPIs with target zones, vs-target deltas and a 12-week trend chart.
View template
Retail KPI Scorecard (Excel)
A weekly KPI scorecard built in Excel for store managers and district leaders. Tracks 12 retail KPIs with conditional formatting, sparklines and YoY comparison.
View template
Sales Target Tracker (Excel)
Set monthly sales targets, log daily actuals, and see pace-to-target instantly. Built for store managers, district leaders and ecommerce category owners.
View template
Explore Related Resources
Handpicked benchmarks, templates and guides to help you dig deeper.