GMROI Explained: The Cornerstone Profitability Metric for Retail Buyers
The most honest profitability metric in retail. How buyers and category managers actually use GMROI to make cross-category assortment, pricing and open-to-buy decisions.
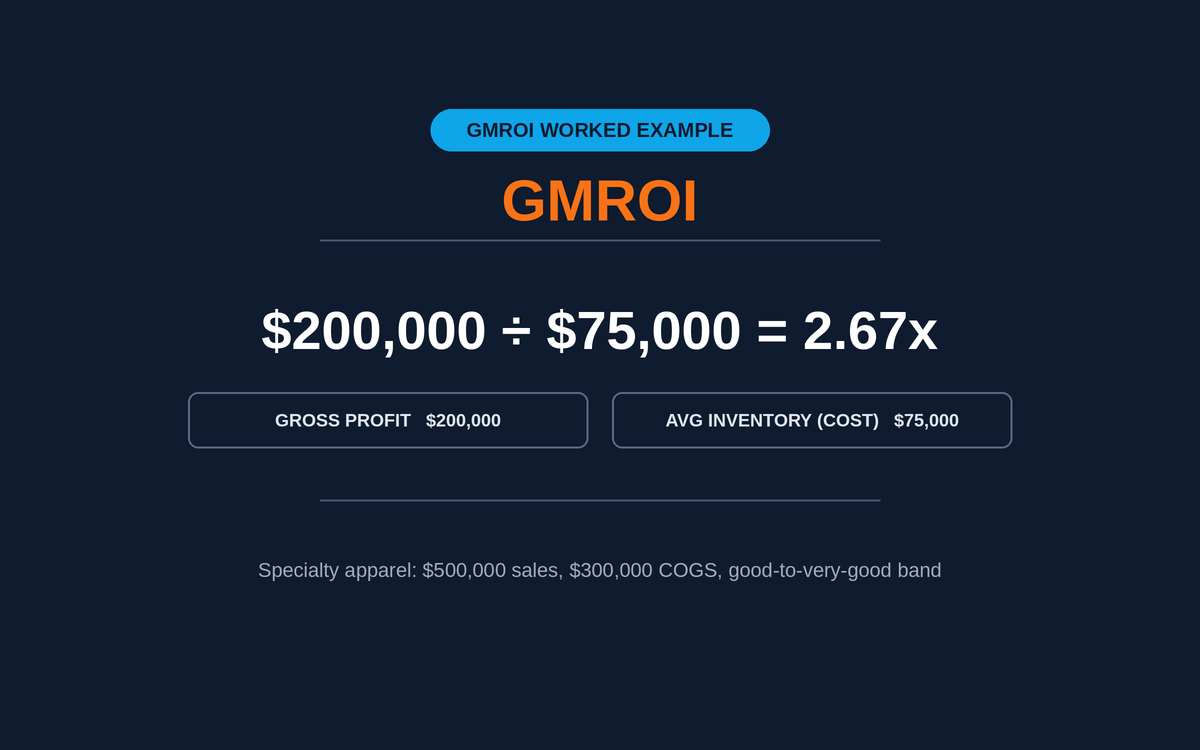
Table of contents+
- What GMROI actually measures
- The formula (and the two inputs that must be right)
- Full worked example
- Performance bands: how to read the number
- Category benchmarks
- Five levers that improve GMROI
- How GMROI connects to the rest of the cluster
- When high GMROI is actually bad
- Common GMROI mistakes
- A three-question decision framework
- Templates and cross-references
- Summary
Every experienced retail buyer eventually runs into the same trap. A category with beautiful margin numbers, glowing supplier terms, and inventory that refuses to sell. The gross margin dashboard looks healthy. The category contribution to gross profit dollars is disappointing. Somewhere between the pricing sheet and the P&L, the story falls apart. GMROI is the number that catches this situation before it becomes a quarterly close problem.
GMROI (Gross Margin Return on Inventory Investment) is the ratio that stops a comfortable margin from hiding an uncomfortable turn. What it measures. The two inputs that make or break accuracy. A full worked example with three what-if scenarios showing how GMROI moves under supplier renegotiation, assortment tightening and reactive promotion. The performance bands that separate acceptable from excellent. Category benchmarks. The five improvement levers ordered by impact. And how GMROI ties together margin, markup, turnover, DIO and ROI into one honest view of category productivity.
What GMROI actually measures
GMROI answers one question every buyer has to answer eventually: for every dollar sitting in average inventory, how many dollars of gross profit did you get back across the year? A GMROI of 2.5x means each inventory dollar produced $2.50 of gross profit. A GMROI of 4.0x means $4.00. Higher is better, but only up to the point where high GMROI comes from inventory starvation rather than merchandising discipline.
Under the hood, GMROI multiplies two operational metrics into one. Gross margin percent captures product-versus-price economics. Inventory turnover captures how efficiently that inventory converts into sales. GMROI = Margin % × Turnover. Chase margin alone and turnover collapses. Chase turnover alone and margin collapses. GMROI catches both, which is why professional category managers optimize against it rather than against either input in isolation.
Gross margin measures pricing discipline. Turnover measures inventory discipline. GMROI is the only number that measures both at once, which is why it is the honest cross-category comparison metric.
The formula (and the two inputs that must be right)
The primary formula is one line.
GMROI = Gross Profit ÷ Average Inventory (at cost)
The equivalent decomposition is Gross Margin % × Inventory Turnover. Both produce the same number. Gross profit is annual gross profit dollars. Average inventory is the average of 12 monthly balances at cost, or (Beginning + Ending) / 2 for stable categories.
Which denominator sits under each half of that decomposition is the part that goes wrong in practice, because a margin figure and a markup figure built from the same two dollars are twenty three points apart. The denominator problem sets out both conventions and where the handoff between buying and finance loses margin points.
Two inputs make or break accuracy. First, average inventory must be at COST, never at retail. Retail inventory value includes markup, which is already counted in the gross profit numerator, so using retail inventory double-counts margin and inflates GMROI artificially. Second, average inventory must be a real average, not the point-in-time ending balance. In seasonal categories the two differ by 15 to 25 percent, and using ending inventory in a Q4 close produces a GMROI number that looks great in January and collapses when a real average gets computed against actual carrying cost. The GMROI Calculator does the arithmetic and returns GMROI alongside gross margin percent, inventory turnover, gross profit, and a plain-English performance band interpretation.
Full worked example
A specialty apparel retailer reports $500,000 annual net sales at retail, $300,000 annual COGS at fully-landed cost, and $75,000 average inventory at cost across 12 monthly balances. Gross profit = $500,000 − $300,000 = $200,000. Gross margin = 40 percent. Inventory turnover = 4.0x per year. GMROI = $200,000 / $75,000 = 2.67x. Every dollar of inventory funded produced $2.67 of gross profit across the year, which sits in the good-to-very-good performance band for apparel.
Three what-if scenarios show what actually moves GMROI in practice.
Supplier renegotiation lifts margin to 45 percent
Category manager runs a full landed-cost review with the top three suppliers. Fully-landed COGS drops from $300,000 to $275,000 at unchanged retail. New gross profit = $225,000. Margin = 45 percent. Turnover unchanged at 4.0x. GMROI = $225,000 / $75,000 = 3.0x. A five-point margin lift at constant turn produced a 12 percent GMROI improvement. This is the highest-leverage lever for most retailers because it does not require touching customer-visible prices.
Assortment tightening lifts turn to 5.0x
Buyer runs ABC classification and prunes the bottom decile of C-tail SKUs. Sales hold flat at $500,000 because those items were low volume anyway. Average inventory drops from $75,000 to $60,000. Turnover rises from 4.0x to 5.0x. Margin unchanged at 40 percent. GMROI = $200,000 / $60,000 = 3.33x. A 20 percent reduction in inventory investment lifted GMROI by 25 percent with no pricing changes and no revenue loss. This is why disciplined assortment management outperforms most other levers on inventory productivity.
Reactive promotion cuts margin to 32 percent
Marketing runs a 20 percent price-off event to drive traffic. Volume rises 20 percent. Net sales climb from $500,000 to $600,000. COGS climbs proportionally to $408,000. Gross profit falls from $200,000 to $192,000. Average inventory unchanged at $75,000. GMROI = $192,000 / $75,000 = 2.56x. Volume rose, revenue rose, but GMROI fell because margin erosion outran volume lift. This is the arithmetic behind the phrase "you cannot promote your way to profitability." Planned promotions with tight volume elasticity assumptions are a different conversation. Reactive discounting almost always destroys GMROI.
Performance bands: how to read the number
GMROI is dimensionless, which makes it comparable across categories that would otherwise be impossible to benchmark directly. The performance bands below hold across most retail verticals with minor adjustment for structural realities.
| GMROI Range | Performance | What it usually means |
|---|---|---|
| Below 1.0x | Poor | Inventory is not carrying its weight. Working capital tied up in slow SKUs is likely. |
| 1.0x to 2.0x | Acceptable | Typical for grocery, electronics and other thin-margin volume categories. |
| 2.0x to 3.5x | Good | Healthy zone for most balanced-margin retail categories. |
| 3.5x to 5.0x | Very good | Well-managed inventory with strong margin discipline. |
| Above 5.0x | Excellent | Category leader territory. Verify with turnover and stockout data before celebrating. |
GMROI performance bands. High GMROI from inventory starvation (chronic stockouts) is not the same as high GMROI from merchandising discipline. Always pair the number with in-stock percent.
Category benchmarks
GMROI benchmarks vary by retail vertical because underlying margin and turn structures differ dramatically.
| Category | Typical GMROI Range | Driver |
|---|---|---|
| Grocery and convenience | 1.5x to 3.0x | Volume, high turn, thin margin |
| Consumer electronics | 1.5x to 3.0x | Fast obsolescence, low margin |
| Health and beauty | 2.5x to 4.5x | Balanced margin and turn |
| Off-price and discount | 3.0x to 5.0x | High turn on opportunistic buys |
| Apparel and fashion | 2.5x to 4.5x | Higher margin balances slower turn |
| Home decor and furniture | 2.0x to 3.5x | High margin, low turn category |
| Jewelry and luxury | 1.5x to 3.0x | Extreme margin, extreme low turn |
Approximate GMROI ranges by retail vertical. The visible driver differs by category; the goal (maximize GMROI without starving service level) is the same.
Five levers that improve GMROI
Ordered by expected impact for a typical retailer sitting at or below category median.
1. Renegotiate landed cost on top-20 SKUs
Highest-leverage lever because it lifts margin without touching customer-visible price. A 2 to 4 percent COGS reduction on the top decile of SKUs typically lifts category GMROI by 8 to 15 percent within a single planning cycle.
2. Prune the C-tail through ABC analysis
Long-tail SKUs eating warehouse cash without producing meaningful gross profit are a hidden GMROI drain. Run ABC classification and prune the bottom decile aggressively. Second-highest-impact lever because it directly reduces the denominator without affecting the numerator materially.
3. Take markdowns earlier
Aged inventory eats gross profit through carrying cost every week it sits. Weekly aged-inventory reports and clear markdown triggers at 8 to 12 weeks past expected sell-through protect margin better than quarterly clearance events. See the Days Inventory Outstanding Guide for the cash-conversion math.
4. Tighten open-to-buy against actual sell-through
Buyers who plan open-to-buy against historical sales rather than forward-looking sell-through systematically over-buy by 10 to 30 percent. Reforecasting monthly against actual sell-through data lifts turnover and GMROI without any pricing changes.
5. Rebalance mix toward higher-GMROI categories
Reallocate open-to-buy dollars from low-GMROI categories to high-GMROI categories. This raises blended GMROI without renegotiating a single supplier. The ABC Analysis Guide covers how to identify which categories deserve more investment.
How GMROI connects to the rest of the cluster
GMROI is the connective tissue that ties every other retail-finance and inventory metric together. Understanding those connections is what separates a spreadsheet operator from a category strategist.
GMROI and gross margin. Margin is one of the two multipliers. Rising margin at constant turn raises GMROI proportionally.
GMROI and markup. Markup drives margin (buyer language for the same lever). Higher markup lifts GMROI unless velocity collapses.
GMROI and inventory turnover. Turnover is the other multiplier. Rising turn at constant margin raises GMROI proportionally.
GMROI and DIO. DIO is turnover in days. Same lever, different unit. Shrinking DIO lifts turn, which lifts GMROI.
GMROI and ABC classification. A-class SKUs almost always produce the highest GMROI dollars. C-class SKUs often carry higher GMROI ratios per unit but produce tiny gross profit dollars because volume is thin.
GMROI and reorder point / safety stock / EOQ. All three affect average inventory. Right-sizing any of them shifts GMROI directly.
GMROI and ROI. GMROI stops at gross profit. Full ROI includes operating expenses and gives a truer picture of category economics. Use GMROI for inventory decisions, ROI for full-cost category decisions.
When high GMROI is actually bad
The most under-taught idea in GMROI management is that a very high number can be the symptom of a problem, not a success. High GMROI produced by inventory starvation (chronic stockouts on A-class SKUs) generates lost sales that never show up in the numerator because they never happened. The finance dashboard celebrates 5.0x GMROI while the store loses top-seller customers who could not find product on the shelf.
The guardrail is to never read GMROI in isolation. Pair it with in-stock percent, service level and stockout frequency. A 5.0x GMROI with 4 percent stockouts on A items is a worse operating outcome than 3.0x GMROI with 0.5 percent stockouts, even though the finance dashboard tells the opposite story. Size safety stock through the Safety Stock Calculator rather than reactively cutting inventory to chase GMROI.
Common GMROI mistakes
Four failures show up repeatedly.
| Mistake | Symptom | Fix |
|---|---|---|
| Average inventory at retail | GMROI inflated 30 to 60 percent above reality | Convert to cost using cost complement before calculation |
| Point-in-time inventory instead of monthly average | GMROI looks great in Q4 close, collapses on true average | Use average of 12 monthly balances |
| Including operating expenses | This is ROI, not GMROI | Keep GMROI at gross profit level; use ROI separately |
| Celebrating GMROI without in-stock check | High GMROI hides chronic stockouts | Pair GMROI with in-stock percent and service level |
Four failure modes that turn GMROI from an honest metric into a misleading one.
A three-question decision framework
Before reading any GMROI number as good or bad, ask three questions.
- What is the category benchmark? A 3.0x GMROI is excellent for jewelry and mediocre for off-price. Compare against direct competitors in the same vertical.
- What are the accompanying in-stock and service-level numbers? High GMROI from inventory starvation is not the same as high GMROI from merchandising discipline.
- Which of the two multipliers is driving it? A GMROI improvement from margin discipline is more sustainable than one from inventory starvation. Ask which lever moved before celebrating.
Templates and cross-references
For live GMROI monitoring across an assortment, the Inventory Management Tracker (Excel) computes SKU-level GMROI alongside margin, turn and DIO. The Retail KPI Cheat Sheet shows where GMROI sits alongside conversion, ATV, UPT and labor cost percent for a category manager’s weekly review pack. The Retail KPI Guide covers the full KPI dashboard hierarchy.
Summary
GMROI is the single most honest cross-category profitability metric in retail because it forces margin and turnover to be read together. It works when average inventory is measured at cost across 12 monthly balances, when the number is paired with in-stock percent and service level, and when improvements are traced to the specific lever that moved (margin discipline vs assortment tightening vs open-to-buy tightening). It becomes misleading when average inventory is taken at retail, when point-in-time balances distort seasonal categories, when operating expenses get incorrectly included, and when high GMROI from inventory starvation gets celebrated as merchandising success. Used correctly alongside gross margin, markup, inventory turnover, DIO and ABC classification, GMROI becomes the cornerstone number professional buyers, category managers and merchandise planners use to make cross-category assortment, pricing and open-to-buy decisions. Run the GMROI Calculator to see the ratio alongside its component parts and a plain-English performance band for your own numbers.
Frequently Asked Questions
What is a good GMROI in retail?+
Below 1.0x is poor. 1.0 to 2.0 is acceptable (typical for grocery and electronics). 2.0 to 3.5 is good. 3.5 to 5.0 is very good. Above 5.0 is excellent. Compare against direct competitors in the same vertical; the category benchmarks table has vertical-specific ranges.
How is GMROI different from gross margin?+
Gross margin measures profitability per sale (percent of revenue). GMROI measures profitability per dollar of inventory. A 60 percent margin on inventory that never sells produces zero GMROI. A 25 percent margin on inventory that turns 10x produces 2.5x GMROI. Different denominators, different insights.
How is GMROI related to inventory turnover?+
GMROI = Gross Margin % × Inventory Turnover. Turn is one of the two multipliers. Rising turn at constant margin raises GMROI proportionally. Chasing margin without watching turn destroys GMROI, and vice versa.
How is GMROI different from ROI?+
GMROI stops at gross profit. ROI includes operating expenses (rent, payroll, marketing). GMROI is the inventory-productivity view. ROI is the full-cost category view. Use GMROI for buying and inventory decisions; use ROI for full category economics.
Which inventory value should I use in the calculation?+
Always at cost, never at retail. Retail inventory value includes markup, which double-counts margin already in the numerator and inflates GMROI by 30 to 60 percent depending on markup structure. Apply the cost complement if your ERP reports at retail.
How can I improve GMROI?+
Five levers: renegotiate landed cost on top-20 SKUs, prune the C-tail through ABC, take markdowns earlier, tighten open-to-buy against actual sell-through, and rebalance mix toward higher-GMROI categories. The guide has tactical detail on each.
Should operating expenses be included?+
No. That is ROI, not GMROI. GMROI is a gross profit metric that measures inventory productivity at the product-economics level. Mixing the two defeats the analytical purpose of each.
Why can GMROI look strong but the business still struggle?+
Because GMROI ignores operating expenses. A 4x GMROI category with heavy staffing and store footprint costs can still lose money at operating margin. Use GMROI alongside operating margin and category contribution to see the full picture.
Can GMROI be too high?+
Yes, in one specific way. Very high GMROI produced by chronic stockouts (inventory starvation) generates lost sales that never appear in the numerator. Pair GMROI with in-stock percent and service level. A 5.0x GMROI with 4 percent stockouts is a worse outcome than 3.0x with 0.5 percent stockouts.
How often should GMROI be reviewed?+
Monthly at the category level with quarterly deep dives on the bottom quartile. Bestsellers should be checked before each promotion cycle. GMROI trending down over 2 to 3 months signals margin erosion, inventory bloat, or assortment drift; identify which lever moved.
Related Calculators
Try the math from this guide with our free tools.
GMROI Calculator
The single most honest cross-category profitability metric in retail. GMROI answers one question: for every dollar of inventory you funded, how many dollars of gross profit did you get back? A high gross margin on inventory that never sells produces zero return, which is why GMROI keeps margin and inventory turnover honest against each other. The output is the GMROI ratio with gross margin percent, inventory turnover, gross profit and a plain-English performance band, because the ratio on its own tells a buyer very little.
Open calculator
Gross Margin Calculator
The cleanest read on how much of every sales dollar you actually keep after paying for the goods. Gross margin drives every downstream financial decision in retail: what to price, what to promote, what to keep on the shelf. Margin percent, the markup equivalent, cost as a percent of revenue and the price-to-cost multiplier all appear together, which is what it takes to translate between the three lenses without reaching for a second tool. The COGS input behind all of it depends on how inventory is valued in the first place, and a retailer using the retail inventory method will get a different COGS figure than one costing at actual unit cost, even from identical sales and purchase data.
Open calculator
Markup Calculator
Set a selling price from cost or reverse-engineer the markup baked into an existing price. Markup is the buyer’s language of pricing (percent added on top of cost), while margin is the finance language (percent kept from revenue). Alongside markup percent come profit per unit, the margin equivalent and the price-to-cost multiplier. Buying and finance can then argue about the price rather than about the denominator. Departments already running the retail inventory method calculator have a cost-to-retail ratio on hand, which doubles as a fast sanity check against the markup this page returns.
Open calculator
Inventory Turnover Calculator
Measure how many times a year your average inventory sells through and gets replaced. The single most consequential operational KPI in retail. It connects buying decisions, warehouse cash, markdown risk, and finance targets into one number. The turn ratio arrives converted into days and weeks of supply, together with the working capital a one-turn improvement would release. Departments that carry stock at retail value rather than cost usually track it with a retail inventory method tracking template, which produces the same average-inventory figure this calculator needs.
Open calculator
Days Inventory Outstanding Calculator
Convert your inventory position into a number finance actually reads: the average days of cash sitting on the warehouse floor. DIO is the same measurement as inventory turnover in days instead of a ratio, and it maps directly onto working capital, cash conversion cycle and reorder cadence. Four numbers come out: DIO, weeks of supply, implied turnover, and the cash a 10-day improvement would release.
Open calculator
ABC Analysis Calculator
Paste a list of SKUs and their revenue and get an instant A / B / C classification. Use the output to set service levels, safety stock, and buying priority the way experienced planners do.
Open calculator
ROI Calculator
Return on investment answers a narrower question than most retail metrics: for this specific dollar spent, on this specific project, how much came back? Unlike gross margin or GMROI, which measure ongoing operating performance, ROI is a one-time verdict on a decision that has already been made or is about to be. A new POS system, a seasonal display buildout, a marketing campaign, a store remodel, an inventory buy that didn't fit the normal replenishment cycle. The ROI percent and the net return are the whole output, which is usually all a finance review asks for.
Open calculator
Related Articles
Gross Margin Explained: The Retail Operator’s Guide to the Number That Runs the P&L
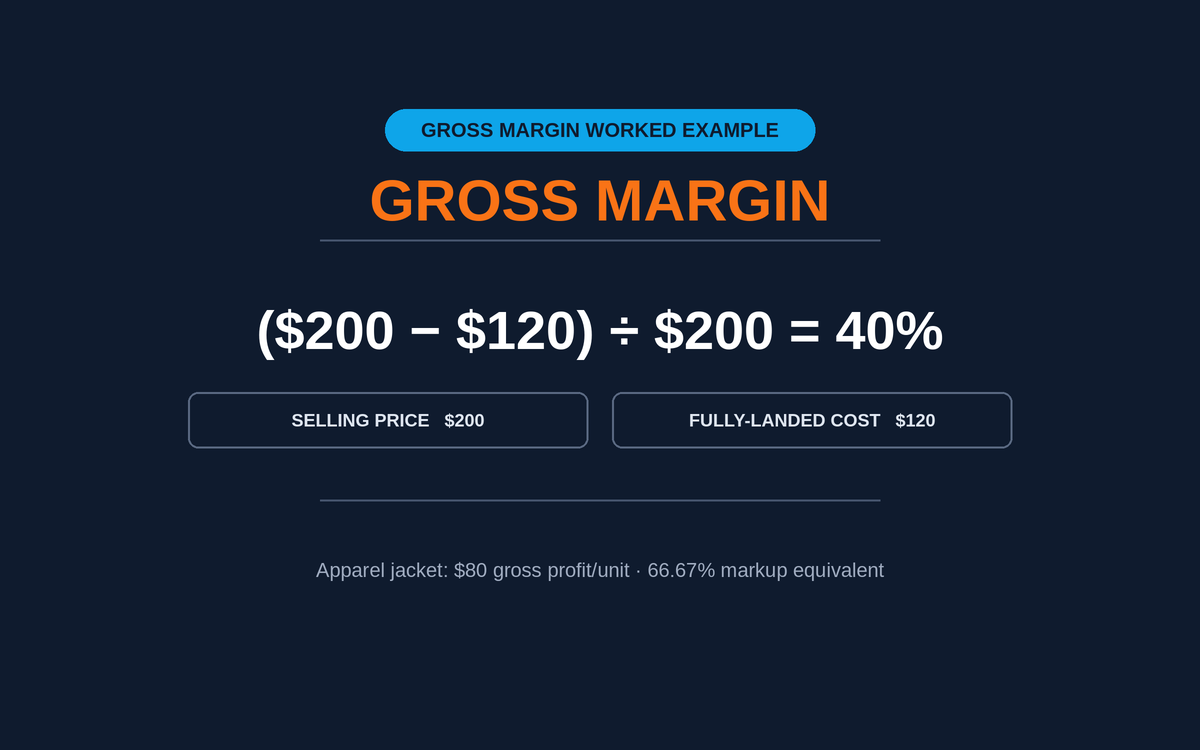
How buyers and finance actually work gross margin. The formula, three what-if scenarios, the margin-vs-markup translation, category benchmarks, GMROI, and the seven levers that move margin on purpose.
Markup Explained: The Retail Buyer’s Pricing Language
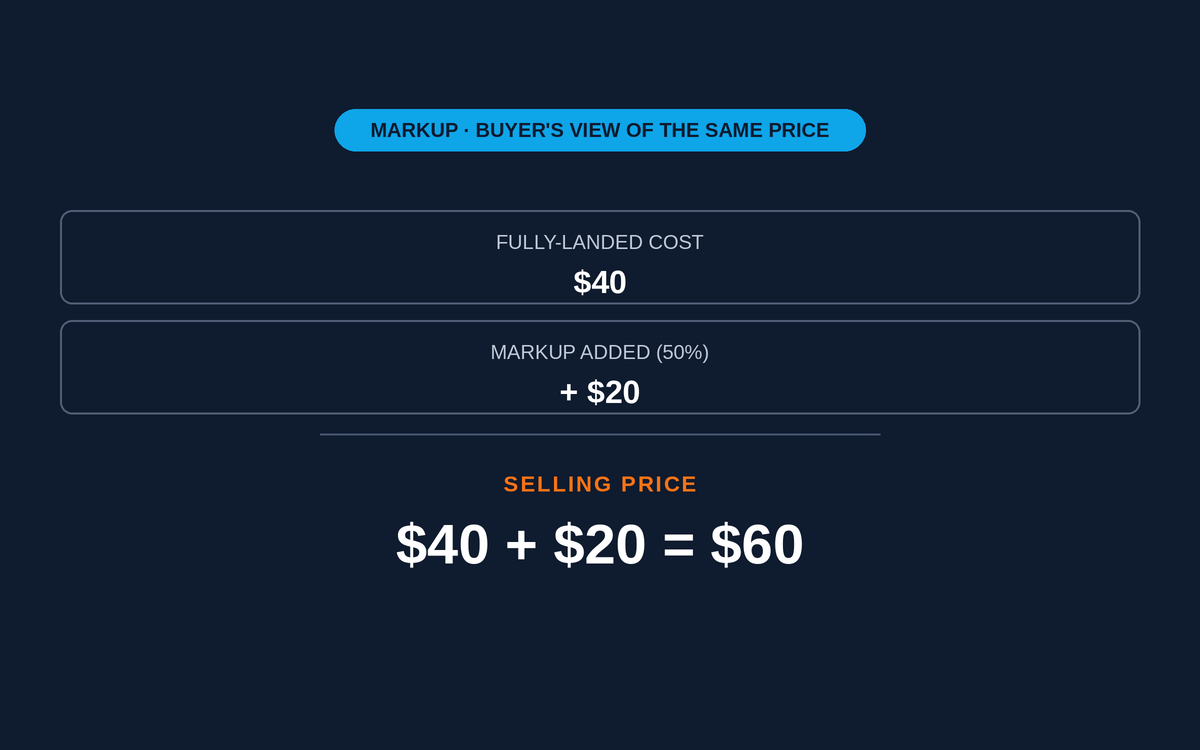
How retail buyers actually work markup. The formula, three what-if scenarios, category benchmarks, keystone pricing, the markup-to-margin translation, and the levers that keep markup honest against turnover.
Sell-Through Rate Explained: The Buyer’s Speed-of-Sale Metric
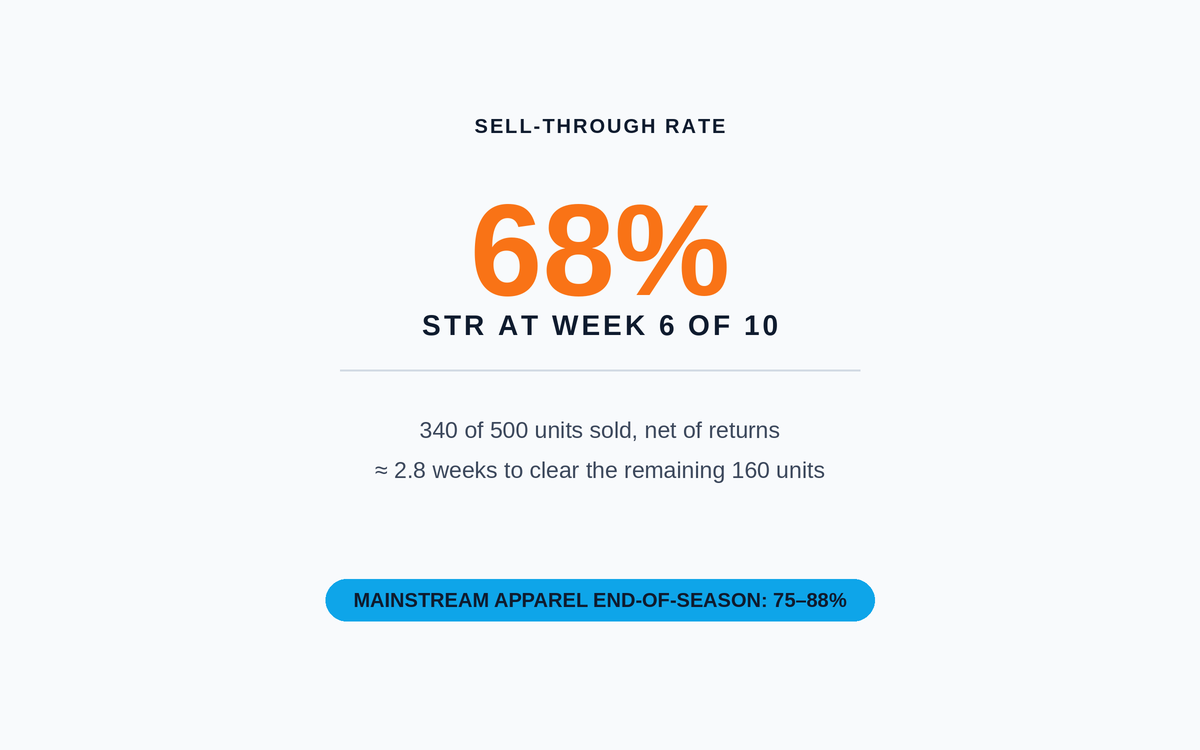
The leading indicator every seasonal buyer reads weekly. How to compute STR the right way, plot it against a target curve, and use it to catch over-buying before it turns into aged inventory.
Explore Related Resources
Handpicked benchmarks, templates and guides to help you dig deeper.