The Denominator Problem: Why Two People Calculate the Same Store Differently
A buyer and a controller report different margins on the same category and both are right. Where the two conventions came from, which metrics mislead and when, and how to decide which number has authority.
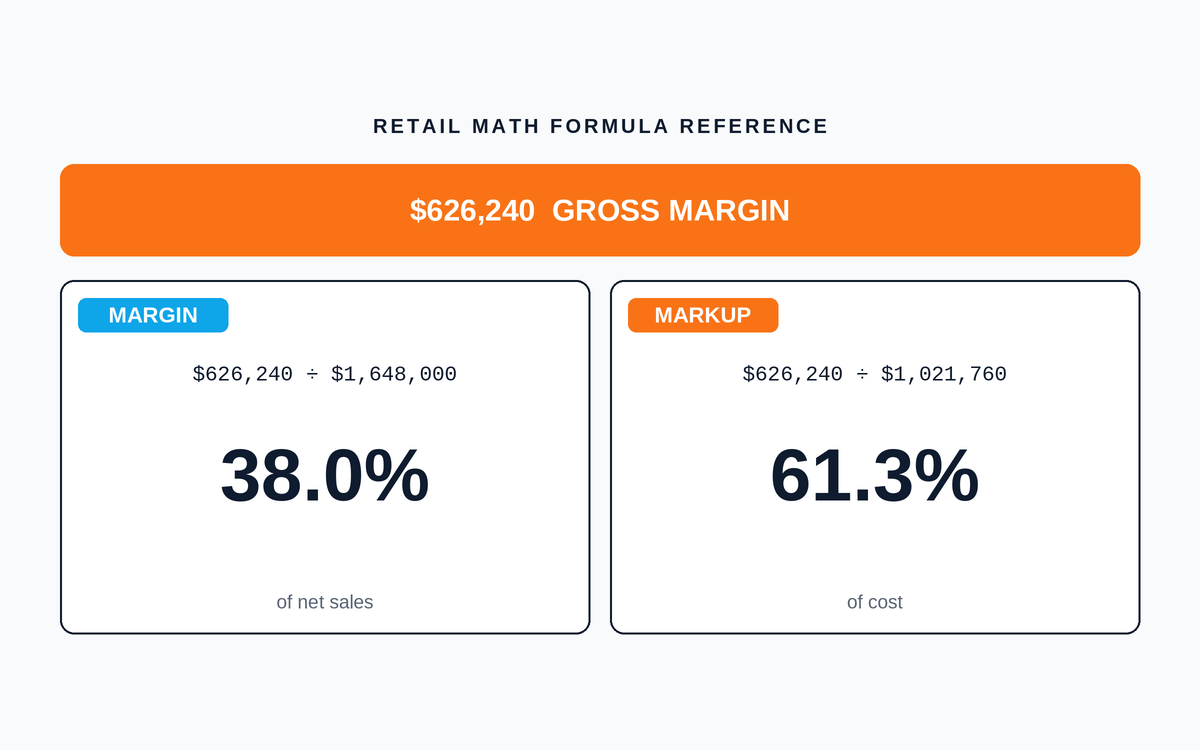
Table of contents+
Ask a buyer and a controller to report the margin on the same category and you will often get two numbers, several points apart, both produced correctly. Ask which is right and the conversation goes nowhere useful, because the question has no answer. Ask instead what each of them divided by, and it resolves in about ninety seconds.
The buyer divided by cost. The controller divided by sales. Both conventions are old, both are correct inside the profession that built them, and the disagreement is not really about mathematics at all. It is about the fact that two different jobs needed two different questions answered from the same pair of dollar figures.
Retail math errors are usually denominator errors, not arithmetic errors. Margin divides the gross margin dollars by net sales, markup divides the same dollars by cost, and the two conventions produce different percentages from identical inputs. Deciding which denominator a report uses, and writing it down, prevents most retail KPI disputes.
Two professions, two conventions
The buyer’s convention comes from the purchasing side of the business. A buyer stands in front of a vendor with a cost and needs to know what to charge. The natural question is “how much do I add on top of what I paid”, and the natural base is what they paid. Markup on cost answers that directly, and it has the practical virtue of being usable at the moment of decision, before a single unit has sold.
The controller’s convention comes from the accounting side. A controller looks at a period that has closed and needs to know what share of the money that came in was kept. The natural base there is revenue, because revenue is the top line of the statement and every other figure on it is understood as a proportion of that. Gross margin percentage answers that, and it has the practical virtue of being comparable to every other line in the P&L and to every other company’s P&L.
Neither convention is a mistake. The mistake is the handoff. A margin target set by finance and executed by buying passes between the two houses with no translation step, and the two houses use the same word for different things. The gross margin vs markup guide sets out the conversion in both directions, and it is worth internalizing the two identities rather than looking them up: markup equals margin divided by one minus margin, and margin equals markup divided by one plus markup. A 38 percent margin needs a 61.3 percent markup. A 38 percent markup delivers a 27.5 percent margin. The gap between the target and the delivery, in that one example, is 10.5 margin points on every unit of the buy.
The reason this survives as a live problem, decades after everyone involved learned both formulas, is that neither number ever looks wrong. There is no reconciliation that fails, no control that catches it, no exception report. A buy executed at the wrong convention produces a perfectly ordinary-looking buy sheet, and the shortfall does not appear anywhere until the season’s realized margin lands and someone asks why. By then the goods are costed in and the decision is not reversible.
The traps that survive because the answer stays plausible
That property, plausibility, is the common thread through nearly every retail math failure worth writing about. Arithmetic errors are cheap because they are loud. Divide by the wrong thing and you get a number that is off by a factor of ten and someone notices before lunch. The expensive errors are the ones that land inside the range you were expecting.
Consider average inventory, which appears in the denominator of both inventory turnover and GMROI. Almost every published formula list writes “average inventory” and stops. Average of what, measured how often, is left to the reader. The default in practice is a two-point average of beginning and ending balances, which is defensible for a full year in a business without violent seasonality and increasingly poor as the period gets shorter, because a two-point average of a curve with a spike in the middle is not the average of the curve.
Substituting ending inventory outright is the common shortcut, and it does something worse than being imprecise: it is biased in a predictable direction. Ending inventory is lower than average inventory in any period that closed with a drawdown, which is exactly what a store does going into a slow season or after a clearance event. So the shortcut inflates turnover and GMROI hardest in precisely the periods that went badly. The inventory turnover guide works through what the different averaging bases do to the result across a seasonal year.
Then there is the basis question. Inventory turnover has two constructions, one at cost and one at retail, and published lists print one or the other without saying which. The trap here is unusual, because the two constructions often agree, and that agreement is not evidence of correctness. If your inventory-at-retail figure was produced by taking inventory at cost and dividing by a cost complement, then the same ratio appears on both sides of the conversion by construction and the two methods must agree. They separate only when realized margin diverges from the margin assumed in the conversion, which is what markdowns and mix shift do continuously. A store carrying a classification at 55 percent planned margin that realizes 41 percent after clearance has an inventory-at-retail figure derived from an assumption its own P&L already contradicts. The retail inventory method guide covers how that conversion is built and where it drifts, and it is the single best place to understand why a number can be internally consistent and still wrong about the world.
Choosing which metric to run the business on
Knowing the formulas is the easy half. The harder judgment is deciding which of them should have authority when they disagree, and they disagree routinely.
Margin and turnover are the classic opposed pair. Optimize margin alone and the rational move is to hold expensive, slow-moving, high-spread stock, because every unit sold is worth more. Optimize turnover alone and the rational move is to hold almost nothing and reorder constantly, because the ratio improves as the denominator shrinks regardless of what happens to the spread. Both policies are defensible on their own metric and both destroy value when pursued to their conclusion.
GMROI exists to end that argument, and it does it by putting gross margin dollars over the average inventory investment that produced them. It is worth understanding that it decomposes exactly:
GMROI = [ Margin % ÷ (1 − Margin %) ] × Inventory Turnover
The identity is not a curiosity. It is the whole decision framework in one line. Two stores can post identical GMROI from opposite operating models, one running a high spread on slow stock and one running a thin spread on fast stock, and the composite number alone will not tell you which you are looking at or what to change. Decomposing it will. If the margin factor is the short one, the answer is a pricing or sourcing conversation. If the turnover factor is the short one, the answer is an assortment or replenishment conversation. Those are different meetings with different people, and reading only the composite sends you to the wrong one. The GMROI guide goes further into reading the two factors against each other by category.
The framework extends past GMROI. Most of the arguments in a retail review are between a rate and a dollar figure, and the rate usually wins the argument while the dollars usually pay the rent. A category can improve its margin rate every quarter by shedding its lowest-margin volume and shrink its gross margin dollars the whole time. This is the most common way a genuinely healthy-looking KPI set accompanies a business getting smaller, and the defense against it is simple discipline: never review a rate without the dollar figure beside it, and never review either without the prior period.
When the metric misleads
Every metric on the cheat sheet has conditions under which it stops being informative, and knowing those is more valuable than knowing another formula.
Sell-through rate is the most misread of the set, because it has no meaning without a time position. Sixty percent sold through is excellent at week four of a twelve week season and alarming at week eleven, and the number itself carries no information about which. Reported as a bare percentage against a bare target it will approve markdowns that were not needed and delay markdowns that were. It requires a plan curve to compare against, and the sell-through rate guide covers building one. On continuity basics it is close to meaningless in any case, because a replenished line never runs out of units available to sell through.
Conversion rate misleads across channels rather than across time. A door counter registers roughly one count per visitor. A web analytics session does not, because one shopper generates several across devices and days. Ecommerce conversion rates therefore read structurally lower than store conversion rates as a matter of measurement rather than performance, and an omnichannel report that puts the two in adjacent columns is inviting a wrong conclusion every month. Conversion rate optimization for stores covers what actually moves the store number, which is a different list from what moves the web one.
Sales per square foot misleads whenever the denominator is redefined, which happens more often than anyone expects: a remeasure, a stockroom conversion, a fixture reset that changes what counts as selling floor. The metric is genuinely useful for comparing like formats and genuinely misleading across formats, since a warehouse club and a jewelry counter are not attempting the same thing per square foot. Sales per square foot covers the format comparability problem in more detail.
Shrink rate misleads on timing rather than definition. It arrives on the physical count schedule, which for most stores is once or twice a year, so it reports a loss that accumulated across many months as though it belonged to the period the count landed in. Attributing a full year of shrink to the quarter in which it was discovered has ended more than one manager’s bonus unfairly, and the shrinkage guide covers how to spread it sensibly.
And OTIF misleads by being harsher than people expect. An order arriving complete one day late fails. An order arriving on time with one line short fails. Compared against a line-level fill rate on the same deliveries, OTIF will always read lower, and the gap between the two is itself the useful signal: a wide gap says failures are scattered across many orders rather than concentrated in a few, which is a different supplier conversation.
The practical discipline
None of this requires better mathematics. It requires three habits.
Write the basis on the report. Every ratio should carry, somewhere visible, what its denominator is: cost or retail, average or ending, net or gross, FTE or headcount. Most disputes end the moment both parties can see this.
Compare against yourself first. The site publishes gross margin benchmarks drawn from NYU Stern’s margins-by-sector dataset, which is a real citable source, and those are useful for orientation. But no comparable public dataset exists for most retail KPIs, and the ranges that circulate for GMROI, sell-through and stock-to-sales generally cannot be traced to one. Your own prior period is a better comparison than an unsourced industry figure, because at least you know how it was calculated.
Recompute the thing you are about to act on. Not every number every week, but the one that is about to justify a markdown, a buy or a headcount decision. The retail KPI cheat sheet computes all twenty-one metrics from one store’s figures so you can see how they tie together, the retail KPI formulas workbook carries the same 21 formulas as live Excel cells, and the retail KPI scorecard template is where they go once you want them tracked period over period rather than calculated once and argued about.
The buyer and the controller in the opening were both right. They stayed in disagreement only as long as it took to ask what each of them had divided by. Most retail math arguments are that argument, and they are all settled the same way.
Frequently Asked Questions
Which retail metric should I report to a board?+
Gross margin dollars and the prior period beside them, with the rate as supporting detail rather than the headline. A board reading a rate alone cannot tell a margin improvement from a business shrinking into a smaller, richer mix, and those need opposite responses. If only one ratio makes the page, GMROI is the honest single number, because it is the only one that moves when either half of the retail equation moves.
Should a KPI be reviewed on a fixed schedule or only when a decision needs it?+
Both, and the split follows how fast the metric can actually move. Conversion, average transaction value and units per transaction respond to execution inside a week, so a weekly rhythm on those is real. Margin, turnover and GMROI respond to buying decisions made four to twelve weeks earlier, so a weekly reading of those produces noise that people then act on. Everything else is diagnostic: pull it when a specific question needs answering. The retail KPI cheat sheet sets out which metric belongs to which cadence.
What is the fastest way to tell whether a report uses a cost basis or a retail basis?+
Divide the inventory figure by net sales and see whether the answer lands near the cost complement or near one. A retail-basis inventory figure is larger than a cost-basis one by roughly the inverse of the cost complement, so the two are usually separated by a wide enough gap to be obvious once you look. Failing that, check whether the turnover numerator is COGS or net sales, since the numerator and denominator have to be on the same basis for the ratio to mean anything.
Our buyers and our finance team report different margin numbers. Who should change?+
Neither, in the sense of abandoning their convention, because each one is answering the question their job actually asks. What has to change is the handoff. Targets should be set in one convention and translated once, in writing, at the point they pass between the two groups, rather than each side assuming the other meant what they meant. The gross margin vs markup guide is the conversion table to translate against.
If a category’s margin rate is rising, why would its gross margin dollars fall?+
Because a rate is a ratio and dollars are a quantity, and shedding volume moves them in opposite directions. Drop the lowest-margin lines in an assortment and the average margin of what remains goes up while the total spread earned goes down. Nothing about the reporting is wrong, and every number is accurate. It is simply possible for a category to look healthier every quarter while contributing less every quarter, which is why the rate and the dollar figure belong on the same line of the same report.
Can a metric be worth calculating if nobody acts on it?+
Rarely, and a KPI set that nobody acts on is usually too large rather than too small. The practical test is whether you can name the decision the number would change and the person who would make it. Metrics that fail that test are worth computing once to establish where you stand, then retiring from the recurring pack. The exception is a metric held as a control rather than a driver, such as shrink rate, which earns its place by catching a problem rather than by prompting a weekly action.
Where do these two conventions come from, and why were they never reconciled?+
They come from two jobs that needed different questions answered from the same two dollar figures, one before the goods were bought and one after the period had closed. They were never reconciled because neither side has an incentive to move: markup on cost is usable at the moment of a buy, and gross margin percentage is comparable across a P&L and across companies. A single convention would make one of those two jobs harder, so both survived, and the cost of that has been pushed onto everyone standing between them.
What should someone new to retail math learn first?+
Not the formulas. The four base figures they all sit on, which are net sales, cost of goods sold, average inventory at cost and a unit count, and what each one includes and excludes. Someone who can produce those four cleanly can derive most of the rest from first principles, and someone who cannot will get plausible wrong answers from a formula list no matter how long it is. The retail inventory method guide is the deepest of the definitional pieces and the best second stop.
Related Calculators
Try the math from this guide with our free tools.
Gross Margin Calculator
The cleanest read on how much of every sales dollar you actually keep after paying for the goods. Gross margin drives every downstream financial decision in retail: what to price, what to promote, what to keep on the shelf. Margin percent, the markup equivalent, cost as a percent of revenue and the price-to-cost multiplier all appear together, which is what it takes to translate between the three lenses without reaching for a second tool. The COGS input behind all of it depends on how inventory is valued in the first place, and a retailer using the retail inventory method will get a different COGS figure than one costing at actual unit cost, even from identical sales and purchase data.
Open calculator
Markup Calculator
Set a selling price from cost or reverse-engineer the markup baked into an existing price. Markup is the buyer’s language of pricing (percent added on top of cost), while margin is the finance language (percent kept from revenue). Alongside markup percent come profit per unit, the margin equivalent and the price-to-cost multiplier. Buying and finance can then argue about the price rather than about the denominator. Departments already running the retail inventory method calculator have a cost-to-retail ratio on hand, which doubles as a fast sanity check against the markup this page returns.
Open calculator
GMROI Calculator
The single most honest cross-category profitability metric in retail. GMROI answers one question: for every dollar of inventory you funded, how many dollars of gross profit did you get back? A high gross margin on inventory that never sells produces zero return, which is why GMROI keeps margin and inventory turnover honest against each other. The output is the GMROI ratio with gross margin percent, inventory turnover, gross profit and a plain-English performance band, because the ratio on its own tells a buyer very little.
Open calculator
Inventory Turnover Calculator
Measure how many times a year your average inventory sells through and gets replaced. The single most consequential operational KPI in retail. It connects buying decisions, warehouse cash, markdown risk, and finance targets into one number. The turn ratio arrives converted into days and weeks of supply, together with the working capital a one-turn improvement would release. Departments that carry stock at retail value rather than cost usually track it with a retail inventory method tracking template, which produces the same average-inventory figure this calculator needs.
Open calculator
Sell-Through Rate Calculator
The speed-of-sale metric every buyer, planner and category manager reads before touching pricing or reorder decisions. Sell-through rate measures the percent of received units that actually sold across the measurement window. High sell-through means the buy is working. Low sell-through means the inventory is aging faster than expected and the markdown clock is running. Enter units sold and units received and the STR percent arrives next to remaining units, weekly sell rate, and projected weeks to both 80 percent and 100 percent sell-through, with a plain-English band saying whether the buy is on pace. The point of the band is to be acted on, not filed.
Open calculator
Markdown Calculator
The pricing tool every buyer and merchandiser reaches for when inventory is running behind sell-through pace. Out comes the markdown amount, the markdown percent, the final selling price, and, once a cost is entered, the resulting gross profit and margin percent. It also flags whether the markdown depth is promotional, seasonal, aggressive or clearance-tier, and generates practical next-step recommendations tied to gross margin, GMROI, sell-through rate and inventory turnover. A markdown also changes the inventory value carried under the retail inventory method, so it is worth re-checking that ratio after a significant markdown event rather than waiting for the next period close.
Open calculator
Related Articles

Gross Margin Explained: The Retail Operator’s Guide to the Number That Runs the P&L
How buyers and finance actually work gross margin. The formula, three what-if scenarios, the margin-vs-markup translation, category benchmarks, GMROI, and the seven levers that move margin on purpose.
GMROI Explained: The Cornerstone Profitability Metric for Retail Buyers
The most honest profitability metric in retail. How buyers and category managers actually use GMROI to make cross-category assortment, pricing and open-to-buy decisions.

Gross Margin vs Markup: The Difference Every Retailer Must Know
These two numbers are not the same. Confusing them is the most common pricing mistake in retail. Here is a clear, example-driven breakdown with a conversion chart.
Explore Related Resources
Handpicked benchmarks, templates and guides to help you dig deeper.