Markup Explained: The Retail Buyer’s Pricing Language
How retail buyers actually work markup. The formula, three what-if scenarios, category benchmarks, keystone pricing, the markup-to-margin translation, and the levers that keep markup honest against turnover.
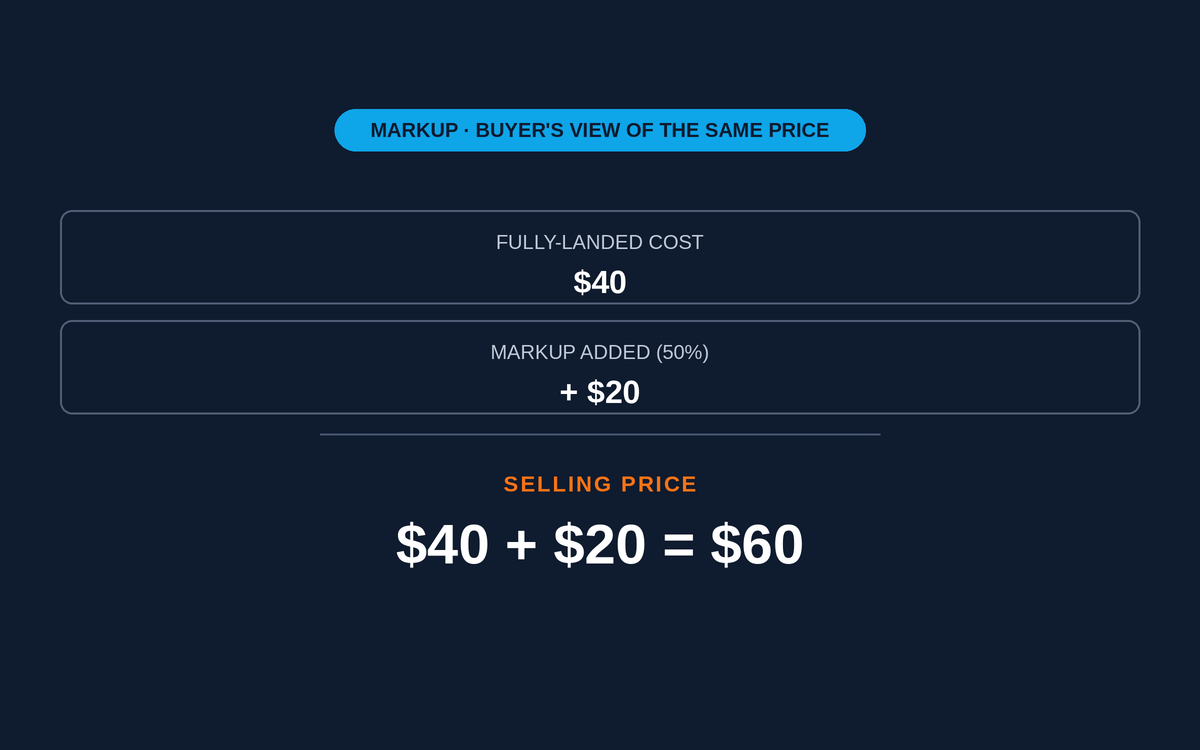
Table of contents+
- What markup actually measures
- The formula (and the one denominator everyone gets wrong)
- Full worked example
- Markup to margin conversion table
- Category benchmarks
- Keystone pricing and when it still works
- How markup interacts with the rest of the cluster
- Common markup mistakes
- A three-question decision framework
- Templates and cross-references
- Summary
Every pricing meeting in retail runs the same script. The buyer walks in talking markup. Finance walks in talking margin. Both are looking at the same product. Both are correct. Neither is talking about the same denominator. Twenty minutes later somebody pulls up a translation table and the actual pricing decision finally starts.
Buyers work in markup all day and finance reports in margin, and the translation between the two is where money quietly goes missing. What the number measures. The one denominator confusion that costs pricing teams days of wasted meeting time. A full worked example with three what-if scenarios showing what happens when price, cost or competitor pricing moves. Category benchmarks by retail vertical. Keystone pricing and where it still works. The markup-to-margin translation table. And the four mistakes that turn a buyer’s markup discipline into a merchandising problem finance eventually has to clean up.
What markup actually measures
Markup is the percentage added on top of cost to reach the selling price. A 50 percent markup means the buyer paid $1 to the supplier and added 50 cents to reach a $1.50 retail. It is the buyer-facing view of pricing because supplier catalogues quote cost, and adding a percentage on top of that cost is the arithmetic buyers do dozens of times a day.
The number sits on the cost side of the P&L, whereas gross margin sits on the revenue side. Same product economics, different denominator. This single denominator difference is the source of most cross-functional pricing friction, and getting the two teams on the same page is the fastest single improvement most pricing operations can make.
If buyers and finance argue about pricing without agreeing on whether they are talking markup or margin, you are watching two teams solve the same equation with different variables and expecting the same answer.
The formula (and the one denominator everyone gets wrong)
The standard markup formula is one line.
Markup % = ((Selling Price − Cost) / Cost) × 100
Cost is fully-landed cost: supplier invoice plus inbound freight, duty and direct handling. Selling Price is net selling price after refunds, excluding sales tax. The mistake first-time buyers make is using invoice cost alone in the denominator. Invoice cost typically understates true landed cost by 3 to 8 percent on domestic sourcing and 10 to 15 percent on offshore-imported goods. Understated cost means overstated markup. The pricing decision made on the wrong number produces a margin that finance eventually reports as a shortfall, and the buyer takes the hit for a problem that started with an accounting shortcut. The Markup Calculator does the arithmetic and returns markup alongside profit per unit, margin equivalent, and the price-to-cost multiplier so pricing decisions get made in the right language.
Full worked example
A hardware buyer purchases a garden hose from the supplier. Invoice cost is $37. Inbound freight, duty and direct handling add another $3, giving fully-landed cost of $40. The category strategy calls for a $60 selling price. Markup = ((60 − 40) / 40) × 100 = 50 percent. Profit per unit = $20. Margin equivalent = 33.3 percent. Price-to-cost multiplier = 1.5x. Three what-if scenarios show how the levers move.
Buyer targets keystone pricing (2x cost)
Keystone means 100 percent markup, which is a 50 percent margin, which is a 2.0x price-to-cost multiplier. New price = $40 × 2 = $80. Profit per unit = $40. This is 100 percent more gross profit per unit at 33 percent higher price, which is why keystone is the traditional default for private label, apparel and many home goods categories. Keystone is a starting point, not a universal target. It works when demand supports the price, and it produces margin that funds full retail operations comfortably.
Buyer matches a competitor at $55
New markup = ((55 − 40) / 40) × 100 = 37.5 percent. Margin equivalent = 27.3 percent. Profit per unit = $15. A $5 price drop cost the retailer $5 of profit per unit, which is a 25 percent reduction in gross profit dollars from an 8 percent price decrease. Small price cuts matter more than they appear because they attack the profit side directly, not the cost side. Every competitive price-match decision should be paired with a volume elasticity assumption to check whether the additional units make up for the lost profit per unit.
Finance asks the buyer to hit 40 percent margin
Back-solve using the conversion: markup = margin / (1 − margin) = 0.4 / 0.6 = 0.667 = 66.7 percent markup. New price = $40 × 1.667 = $66.67. This is the exact same product economics as finance’s 40 percent margin target, translated into the markup language the buyer works in every day. A pricing meeting that opens with this translation done in advance runs in ten minutes instead of an hour.
Markup to margin conversion table
Both metrics describe the same product economics. The translation is worth memorizing because it comes up in every pricing conversation.
| Markup % | Margin % | Price-to-Cost Multiplier |
|---|---|---|
| 25% | 20.0% | 1.25× |
| 33% | 25.0% | 1.33× |
| 50% | 33.3% | 1.50× |
| 66.7% | 40.0% | 1.67× |
| 100% | 50.0% | 2.00× (keystone) |
| 150% | 60.0% | 2.50× |
| 200% | 66.7% | 3.00× |
| 300% | 75.0% | 4.00× |
Markup-to-margin conversion. See the Gross Margin Calculator for the inverse translation.
Category benchmarks
Markup varies dramatically by retail category. Compare against direct competitors in the same vertical, not against cross-category averages.
| Category | Typical Markup Range | Margin Equivalent |
|---|---|---|
| Grocery and convenience | 25% to 45% | 20% to 31% |
| Consumer electronics | 18% to 35% | 15% to 26% |
| Off-price and discount | 35% to 55% | 26% to 35% |
| Home improvement | 45% to 65% | 31% to 39% |
| Health and beauty | 45% to 80% | 31% to 44% |
| Furniture and home decor | 55% to 100% | 35% to 50% |
| Apparel and fashion | 82% to 150% | 45% to 60% |
| Jewelry and luxury | 100% to 200% | 50% to 67% |
Approximate markup ranges by retail vertical. Higher-markup categories almost always come with lower turnover, which is why GMROI matters more than raw markup alone.
Keystone pricing and when it still works
Keystone pricing is the practice of setting the retail price at exactly twice the cost. It produces a 100 percent markup, a 50 percent margin, and a 2.0x multiplier. Keystone became the traditional retail default because the math is clean, category managers can compute it in their head, and the resulting margin funds full retail operating cost comfortably.
Keystone still works well in apparel, home decor, gift categories and private-label goods where consumers have limited price transparency and demand elasticity is moderate. It works less well in commodity categories with heavy price transparency (grocery, electronics, online-anchored SKUs) where competitive pricing pressure caps the achievable markup. And it works badly on high-velocity SKUs where lower markup with higher turn produces better GMROI than keystone with slower turn.
How markup interacts with the rest of the cluster
Markup is one lens on retail economics. Reading it alongside three other numbers keeps pricing honest.
Markup and gross margin. Two views of the same product. Buyers use markup, finance uses margin. Publishing the translation table for the whole pricing team eliminates most cross-functional friction.
Markup and ROI. Markup lives above the line. ROI extends the conversation to full-cost profitability including inventory carrying cost.
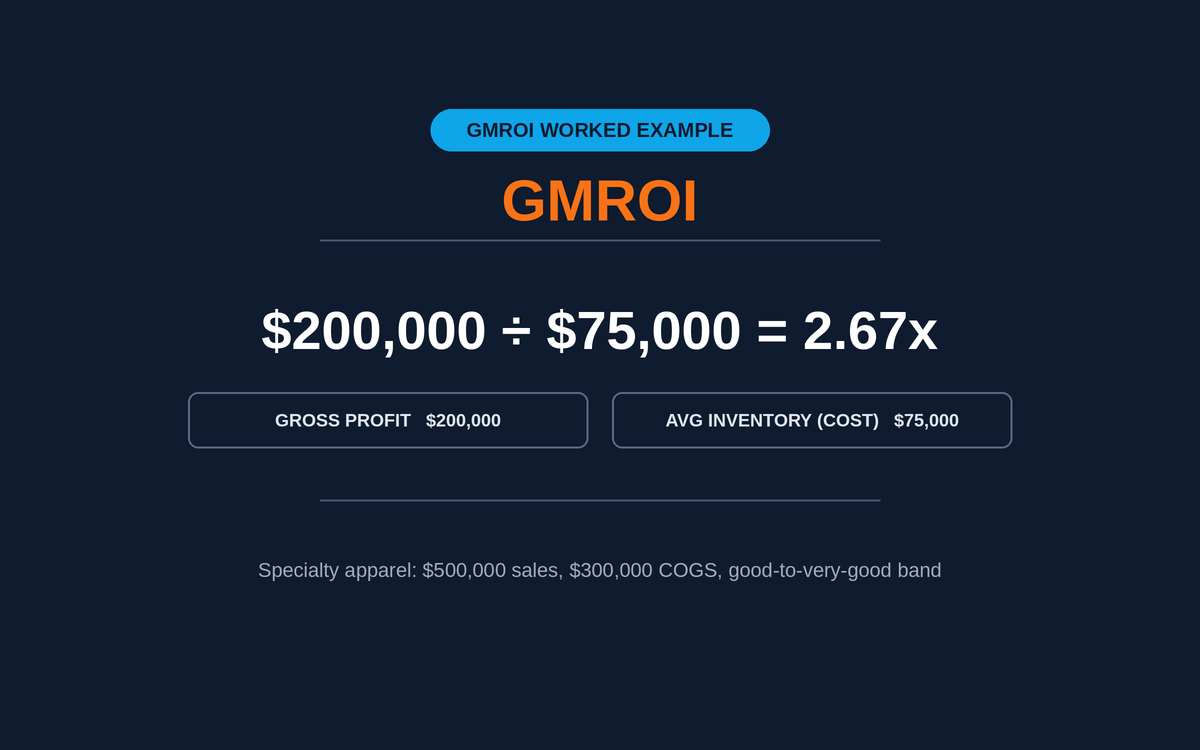
Markup and inventory turnover. GMROI connects them: Margin percent × Turnover. A 100 percent markup at 3x turn produces less annual gross profit than a 50 percent markup at 8x turn. Never celebrate markup in isolation.
Markup and ABC classification. A-class SKUs often support lower markup because velocity is high and price sensitivity is real. C-class assortment breadth items sometimes support higher markup because customers are shopping the category rather than the specific SKU.
Markup and DIO. Higher markup on slow-turning inventory means more days of cash locked in units that produce zero gross profit until they actually sell. Watch DIO alongside markup on any high-markup category.
Common markup mistakes
Four failures show up repeatedly in retail markup reviews. Each has a specific fix.
| Mistake | Symptom | Fix |
|---|---|---|
| Confusing markup with margin | Buyer and finance disagree on same SKU | Publish markup-to-margin table across pricing team |
| Invoice cost instead of landed cost | Markup overstated, real margin lower than expected | Use fully-landed cost from receiving records |
| Blanket markup across assortment | Bestsellers overpriced, tail underpriced | Set target by category, adjust by ABC class |
| Celebrating markup without turnover | High markup on inventory that never sells | Track GMROI, not markup alone |
Four failure modes that turn markup from a useful pricing lever into a merchandising problem.
A three-question decision framework
Before setting or reviewing any markup, ask three questions.
- Is the cost input fully landed? Supplier invoice plus inbound freight plus duty plus receiving labor. If any component is missing, markup is overstated.
- What does the margin equivalent look like, and does it match finance’s target? Every markup decision translates directly into a margin outcome. Do the translation before the meeting, not during.
- What is the GMROI implied by this markup at expected turnover? Markup on inventory that never turns produces zero gross profit. Read the two numbers together, always.
Templates and cross-references
For live markup and margin monitoring across an assortment, the Inventory Management Tracker (Excel) computes SKU-level markup, margin equivalent and GMROI. The Retail KPI Cheat Sheet is the one-page reference showing where markup sits alongside margin, conversion, ATV and UPT in a buyer’s weekly review pack. For broader retail-finance context, the Retail KPI Guide covers how markup fits into the healthy operator dashboard.
Summary
Markup is the buyer-facing pricing language of retail, and it works when the cost input is fully landed, when the margin equivalent is published for finance and the pricing team simultaneously, and when it gets read alongside inventory turnover rather than in isolation. It becomes misleading when invoice cost replaces landed cost, when buyers and finance argue in different denominators, when blanket markup is applied across assortments with wildly different velocity, and when high markup on slow-turning inventory gets celebrated without the GMROI honesty check. Used correctly alongside gross margin, ROI, inventory turnover, DIO and ABC classification, markup becomes the pricing lever that connects supplier negotiation to on-shelf revenue. Run the Markup Calculator to see markup, margin equivalent, profit per unit and the price-to-cost multiplier for your own SKUs.
Frequently Asked Questions
What is the difference between markup and margin?+
Markup is calculated on COST. Margin is calculated on REVENUE. A 50 percent markup equals a 33.3 percent margin. A 100 percent markup equals a 50 percent margin (keystone). Mixing them in a pricing meeting is the single most common source of cross-functional friction. The conversion table in this guide settles the translation.
What is a good markup in retail?+
It varies by category. Grocery: 25 to 45 percent. Electronics: 18 to 35 percent. Apparel: 82 to 150 percent (keystone or above). Home decor: 55 to 100 percent. Jewelry and luxury: 100 to 200 percent. Compare against direct competitors in the same vertical, not against cross-category averages.
What is keystone pricing?+
Keystone means charging exactly double the cost, which is a 100 percent markup and a 50 percent margin. It is the traditional default for private label and apparel because the math is clean and the resulting margin funds full retail operations. Still valid in categories with moderate price transparency; less useful in commodity or online-anchored SKUs.
How do I convert markup to margin?+
Margin = Markup / (1 + Markup). A 50 percent markup: 0.5 / 1.5 = 33.3 percent margin. Reverse: Markup = Margin / (1 − Margin). A 40 percent margin: 0.4 / 0.6 = 66.7 percent markup. The Markup Calculator reports the margin equivalent automatically.
Is higher markup always better?+
No. Higher markup usually means lower unit velocity. Chasing markup without watching inventory turnover destroys GMROI. A 200 percent markup at 1x turn produces less annual gross profit than a 50 percent markup at 8x turn. Read the two together, always.
What should be included in cost when calculating markup?+
Fully-landed cost: supplier invoice, inbound freight, duty and direct handling. Retailers using invoice alone overstate markup by 3 to 8 percent on domestic sourcing and 10 to 15 percent on offshore-imported goods.
Why do buyers use markup instead of margin?+
Because supplier catalogues quote cost, and pricing decisions start from cost. Adding a percentage on top feels natural. Finance reads the P&L top-down from revenue, so margin is their natural fit. Both are correct. The trick is translating between them cleanly in cross-functional meetings.
How does markup connect to open-to-buy planning?+
Open-to-buy dollars are cost-side, and target margin translates directly into the markup applied at PO time. A 45 percent margin target requires an 81.8 percent markup on each SKU. Getting markup wrong at PO time creates a margin shortfall no downstream discipline can recover.
Can I set markup by category rather than by SKU?+
Set a target category markup, then calibrate at SKU level based on velocity and competitive positioning. Bestsellers often justify higher markup. Tail SKUs sometimes need lower markup to move. Run ABC classification to identify where SKU-level adjustments matter most.
What are the most common markup mistakes?+
Four show up repeatedly. Confusing markup with margin. Using invoice cost instead of landed cost. Applying blanket markup across the assortment. And celebrating high markup on slow-turning inventory. Each has a specific fix in the mistakes table in this guide.
Related Calculators
Try the math from this guide with our free tools.
Markup Calculator
Set a selling price from cost or reverse-engineer the markup baked into an existing price. Markup is the buyer’s language of pricing (percent added on top of cost), while margin is the finance language (percent kept from revenue). Alongside markup percent come profit per unit, the margin equivalent and the price-to-cost multiplier. Buying and finance can then argue about the price rather than about the denominator. Departments already running the retail inventory method calculator have a cost-to-retail ratio on hand, which doubles as a fast sanity check against the markup this page returns.
Open calculator
Gross Margin Calculator
The cleanest read on how much of every sales dollar you actually keep after paying for the goods. Gross margin drives every downstream financial decision in retail: what to price, what to promote, what to keep on the shelf. Margin percent, the markup equivalent, cost as a percent of revenue and the price-to-cost multiplier all appear together, which is what it takes to translate between the three lenses without reaching for a second tool. The COGS input behind all of it depends on how inventory is valued in the first place, and a retailer using the retail inventory method will get a different COGS figure than one costing at actual unit cost, even from identical sales and purchase data.
Open calculator
ROI Calculator
Return on investment answers a narrower question than most retail metrics: for this specific dollar spent, on this specific project, how much came back? Unlike gross margin or GMROI, which measure ongoing operating performance, ROI is a one-time verdict on a decision that has already been made or is about to be. A new POS system, a seasonal display buildout, a marketing campaign, a store remodel, an inventory buy that didn't fit the normal replenishment cycle. The ROI percent and the net return are the whole output, which is usually all a finance review asks for.
Open calculator
Inventory Turnover Calculator
Measure how many times a year your average inventory sells through and gets replaced. The single most consequential operational KPI in retail. It connects buying decisions, warehouse cash, markdown risk, and finance targets into one number. The turn ratio arrives converted into days and weeks of supply, together with the working capital a one-turn improvement would release. Departments that carry stock at retail value rather than cost usually track it with a retail inventory method tracking template, which produces the same average-inventory figure this calculator needs.
Open calculator
ABC Analysis Calculator
Paste a list of SKUs and their revenue and get an instant A / B / C classification. Use the output to set service levels, safety stock, and buying priority the way experienced planners do.
Open calculator
Days Inventory Outstanding Calculator
Convert your inventory position into a number finance actually reads: the average days of cash sitting on the warehouse floor. DIO is the same measurement as inventory turnover in days instead of a ratio, and it maps directly onto working capital, cash conversion cycle and reorder cadence. Four numbers come out: DIO, weeks of supply, implied turnover, and the cash a 10-day improvement would release.
Open calculator
Related Articles
Gross Margin Explained: The Retail Operator’s Guide to the Number That Runs the P&L
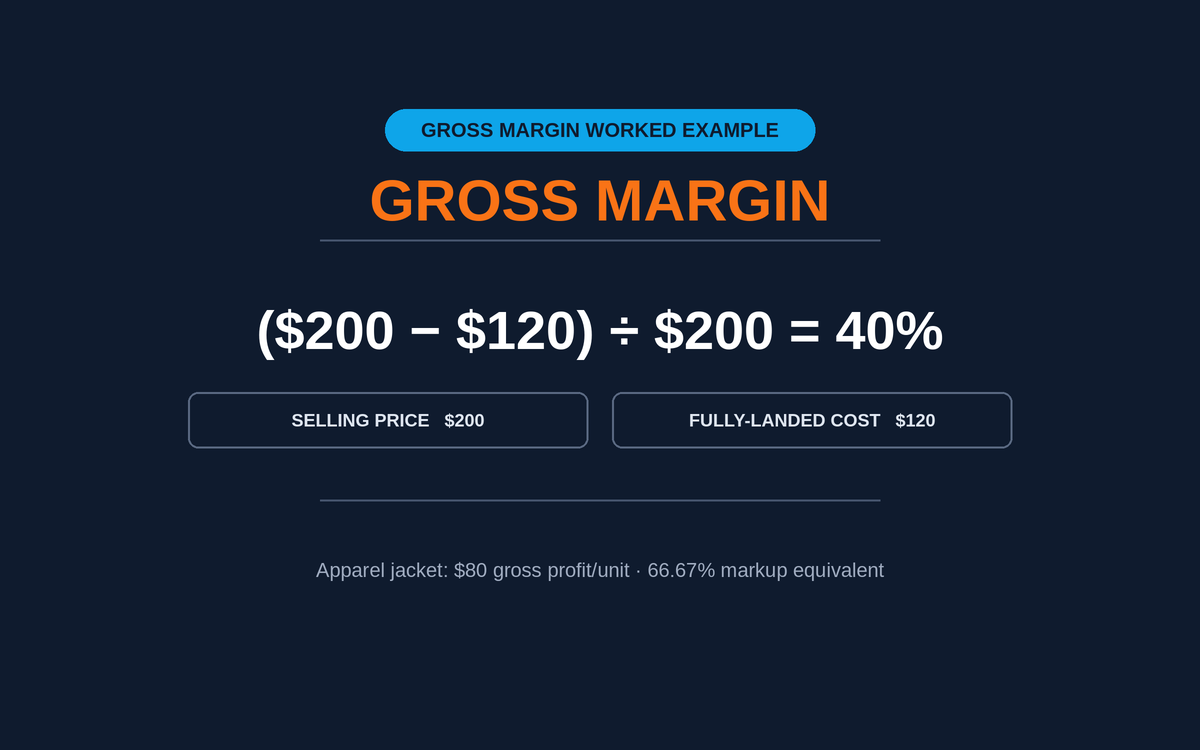
How buyers and finance actually work gross margin. The formula, three what-if scenarios, the margin-vs-markup translation, category benchmarks, GMROI, and the seven levers that move margin on purpose.
GMROI Explained: The Cornerstone Profitability Metric for Retail Buyers
The most honest profitability metric in retail. How buyers and category managers actually use GMROI to make cross-category assortment, pricing and open-to-buy decisions.

Gross Margin vs Markup: The Difference Every Retailer Must Know
These two numbers are not the same. Confusing them is the most common pricing mistake in retail. Here is a clear, example-driven breakdown with a conversion chart.
Explore Related Resources
Handpicked benchmarks, templates and guides to help you dig deeper.