Markdown Pricing Explained: A Retail Operator’s Complete Guide
Everything a buyer, merchandiser or category manager needs to know about markdown pricing. When to trigger a markdown, how to size it, how it affects margin and GMROI, and the mistakes that quietly bleed working capital.
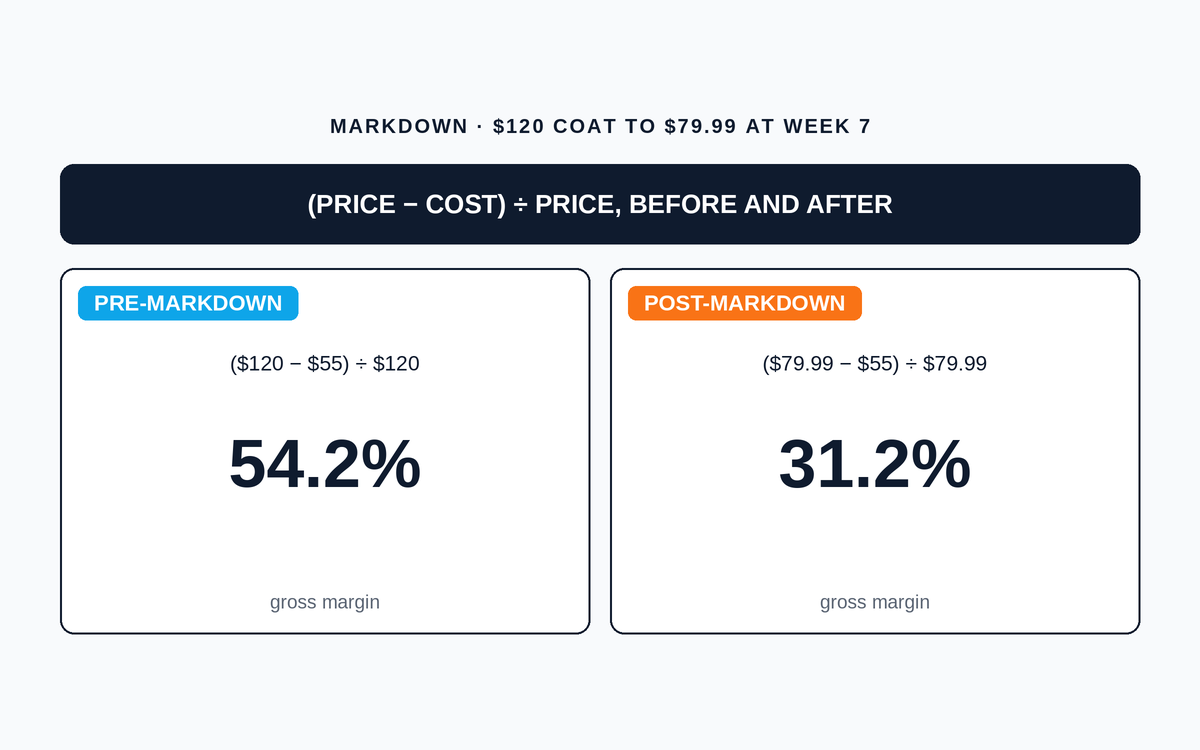
Table of contents+
Every serious retailer eventually learns the same lesson. Markdowns are not a failure signal. They are a management tool. Retailers that treat markdowns as embarrassing accidents end up over-buying at the front of the season and running panicked clearance events at the back. Retailers that plan for markdowns, trigger them on data, and size them with intent end up with cleaner inventory, better working capital and healthier annual margin than the operators who tried to avoid them altogether.
Few levers in retail get pulled as often, or as reflexively, as this one. What a markdown is (and is not). Why retailers use markdowns as a merchandising lever rather than a defeat. The exact formula and the two inputs first-year buyers get wrong. Worked examples with realistic numbers. The critical distinction between markdown and discount, and between markdown and markup. Planned versus unplanned markdown mechanics. Optimisation strategies that actually move the needle. Common pricing mistakes. Industry benchmarks by category. And the discipline that separates retailers running markdowns on purpose from retailers being run by them.
What is a markdown?
A markdown is a permanent reduction of the ticket price of merchandise, taken against gross margin at the point of sale. The new price becomes the working shelf price. It does not revert to the original ticket after a promotional window ends. This is the specific accounting distinction that separates a markdown from a discount, a coupon, a member price or a promotional event, all of which are temporary.
In the P&L, markdowns show up as a direct reduction of gross margin on the SKU. In merchandising language, markdowns are the second-largest controllable line item on the retail P&L after cost of goods sold. Every serious category manager knows the annual markdown rate for their business by heart, because that number is one of the two or three levers that most directly move category profitability.
A useful way to think about markdowns: they are the mechanism through which retail pricing self-corrects between the buyer’s original bet on demand and the actual demand observed in the store. If the bet is right, markdowns stay low and margin stays clean. If the bet is wrong, markdowns fire and margin absorbs the correction. The mistake is treating markdowns as random events instead of as a signal about how well the buying process is calibrated to demand.
Why retailers use markdowns
Markdowns exist because the alternative is worse. Every retailer holding inventory that will not sell at full price is choosing between three outcomes. Hold the inventory and eat carrying cost until it expires or becomes obsolete. Take a markdown and clear it below the original ticket. Or write it off entirely. Markdowns almost always beat the other two options on a total-cost basis.
Four operational reasons drive markdown decisions in a well-run retail business.
- Sell-through recovery. When a SKU is trailing the target sell-through curve, a markdown accelerates velocity to close the gap before the season ends.
- Working capital release. Every week of aged inventory ties up cash that could be redeployed into faster-turning categories. A well-timed markdown converts stuck inventory back into cash for reinvestment.
- Seasonal transition. Assortments that carry heavy seasonal signal (spring apparel, back-to-school, holiday-specific) must clear before the next season lands. Markdowns are the mechanism for that clearance.
- Category refresh. Newness drives traffic. Category managers periodically markdown older SKUs to make floor and open-to-buy space for fresh product.
The mistake most first-year buyers make is treating markdowns as failures. Experienced merchandisers treat markdowns as tools with a specific job to do. The failure is not the markdown itself. The failure is over-buying at the front of the season, or waiting too long to trigger the first markdown, or applying blanket depth without checking SKU-level velocity. Those are the mistakes that cost real money.
The markdown formula
The formula is simple.
Markdown % = ((Original Selling Price − Markdown Price) ÷ Original Selling Price) × 100
Two inputs. One denominator that has to be correct. The denominator is the ORIGINAL selling price, not the markdown price. This is the first year buyer’s most common arithmetic mistake, and it is worth explaining in detail because getting it wrong misleads the pricing team and does not reconcile with finance.
Consider a $120 coat marked down to $80. The dollar markdown is $40. Divide by the original $120 and the markdown percent is 33.3 percent. Divide by the markdown price of $80 and you get 50 percent, which sounds bigger but is arithmetically wrong. The retail convention, the P&L convention and the finance convention all use the original ticket as the denominator. A team that mixes the two ends up in pricing meetings where the buyer thinks the markdown is 50 percent and finance thinks it is 33 percent, and the resulting confusion is the source of endless margin reconciliation problems.
The Markdown Calculator does the arithmetic correctly and returns markdown amount, markdown percent, final selling price, and (when cost is entered as an optional input) post-markdown gross profit and gross margin percent so the price move can be sanity-checked against margin impact in one view.
Use the ORIGINAL selling price as the denominator. Every experienced buyer, category manager and finance partner does the calculation this way. Doing it any other way turns pricing meetings into math arguments.
Worked example
A specialty apparel retailer tickets a wool coat at $120 with a fully-landed cost of $55. Season length is 10 weeks. At week 7, sell-through is running 12 percentage points below the target curve. The buyer triggers a first markdown to $79.99.
Markdown Amount = 120 − 79.99 = $40.01 per unit. Markdown Percent = (40.01 / 120) × 100 ≈ 33.3 percent. Final Selling Price = $79.99. Post-markdown Gross Profit = 79.99 − 55 = $24.99 per unit. Post-markdown Gross Margin = (24.99 / 79.99) × 100 ≈ 31.2 percent.
Compare against the pre-markdown gross margin of (120 − 55) / 120 = 54.2 percent. The markdown surrendered 23 percentage points of margin per unit, but is expected to lift velocity by 60 to 80 percent based on typical category price elasticity. If the velocity lift materialises, the retailer clears the buy inside the remaining 3-week window without a deeper second markdown. If it does not, week 9 will need a second, deeper move.
Three what-if scenarios show the underlying trade-offs.
Shallower first markdown at week 7
Buyer takes 17.5 percent depth to $99 instead. Post-markdown margin holds at 44.4 percent per unit. But velocity in most apparel categories lifts only 20 to 30 percent at that depth, which may not close a 12-point sell-through gap in 3 weeks. Higher chance of a reactive deeper markdown at week 9.
Delayed markdown until week 9
Buyer holds full price until week 9, then takes 45 percent depth to $66 to clear. Post-markdown margin collapses to 16.7 percent per unit. Volume lifts sharply but the retailer sacrificed roughly three times the margin per unit compared to the earlier, shallower move.
Bundle promotion instead of markdown
Buyer keeps the $120 ticket but bundles the coat with a matching scarf at a combined $135. Perceived value rises, ticket integrity is preserved for the coat, and the retailer sacrifices margin only on the bundled scarf. This works when there is a natural adjacency and when the bundled SKU is not itself running against sell-through pressure.
Markdown vs discount
The terms are often used interchangeably in casual conversation but they mean different things in retail accounting and merchandising practice.
| Attribute | Markdown | Discount |
|---|---|---|
| Duration | Permanent price change | Temporary; ticket reverts after event |
| P&L treatment | Direct reduction of gross margin on SKU | Promotion expense or contra-revenue |
| Trigger | Sell-through miss, ageing inventory, seasonal transition | Traffic drive, promotional calendar, loyalty program |
| Merchandising language | Buyer / planner language | Store operator / marketing language |
| Signal to customer | New shelf price is the new normal | Limited-time opportunity |
Markdowns are permanent ticket reductions. Discounts are temporary. The P&L treats them differently, the customer perceives them differently, and the trigger conditions are different.
The reason the distinction matters is operational. Discount programmes belong in the marketing and promotion calendar. Markdowns belong in the merchandising and open-to-buy plan. Confusing which lever is being pulled produces confused reporting, confused customer messaging and confused P&L reconciliation.
Markdown vs markup
Markup and markdown are complementary but opposite operations. Markup is the percentage ADDED to cost to reach the selling price at the point of buy. Markdown is the percentage TAKEN OFF the selling price later in the season. Every SKU carries both a markup at the buy and (potentially) a markdown at the end of the season.
A retailer can operate at 100 percent markup (keystone pricing, meaning the ticket is 2x cost) and still take a 40 percent end-of-season markdown on the same SKU. In fact, retailers with disciplined initial markup structures often absorb heavier planned markdowns more comfortably than retailers with tight initial pricing, because the higher opening margin creates room for the correction. This is the arithmetic that makes private-label programmes attractive: the higher opening margin funds a wider markdown tolerance.
The Gross Margin vs Markup Guide covers the pricing math in more depth. For markdown planning, the practical takeaway is that initial markup should be set with a realistic assumption about what percentage of the buy will need to clear at markdown, and at what average depth. Buyers who set opening tickets ignoring end-of-season markdown reality end up with clean-looking initial margins that erode dramatically by year end.
Planned markdowns
A planned markdown is one built into the seasonal open-to-buy at PO time. The buyer knows in advance that a fraction of the buy will need to clear at reduced margin by end of season, and prices the initial ticket accordingly. The margin impact is absorbed into the plan, not treated as a surprise.
Best-in-class retailers plan 60 to 75 percent of expected markdown dollars into the initial buy. That leaves 25 to 40 percent of markdown activity to manage tactically during the season based on actual sell-through performance. This planning discipline is what separates retailers who report clean seasonal margin numbers from retailers whose year-end margin always seems to fall short of plan.
Planned markdowns typically follow a category-specific cadence.
- Week 25 percent of season: no markdown expected on planned assortment (except promotional cadence).
- Week 50 percent: first planned markdown fires at 15 to 25 percent depth on slower-moving SKUs.
- Week 75 percent: second planned markdown fires at 30 to 40 percent depth on remaining slow SKUs.
- End of season: final clearance at 50 percent-plus depth on residual inventory.
The exact cadence depends on category. Fast fashion runs a more aggressive markdown calendar because assortments turn faster. Furniture and home decor run a much longer, shallower cadence because selling windows are wider and carryover is more acceptable.
Unplanned markdowns
An unplanned markdown is a reactive price reduction taken in response to a sell-through miss that was not built into the plan. These are the markdowns that eat into expected margin dollars and produce the year-end margin shortfall conversations that no buyer enjoys.
Common triggers for unplanned markdowns.
- Weather disruption to a seasonal category (unusually warm winter, cold summer).
- Competitor price move that resets the category shelf-price expectation mid-season.
- Trend miss where the assortment was built around a colour, silhouette or feature that did not resonate.
- Supply chain surprise that landed inventory late, compressing the effective selling window.
- Macro consumer shift (spending pullback, category shift) that affected the whole category.
Unplanned markdowns are not always avoidable, but they are almost always more expensive than earlier, planned action would have been. The typical pattern is that an unplanned markdown at week 8 of a 10-week season costs 2 to 3 times the margin points that a planned 20 percent depth at week 5 would have cost, because the deeper reactive move sacrifices margin on more units and often triggers a second markdown before season end.
The single most valuable discipline in unplanned markdown management is triggering off weekly sell-through data rather than off aged-inventory reports. Sell-through catches the miss at week 4 or 6. Aged inventory reports catch it at week 9, which is too late.
Markdown optimisation strategies
The retailers who consistently deliver clean margin against plan are not the ones who avoid markdowns. They are the ones who optimise how markdowns are triggered, sized and sequenced. Six strategies show up repeatedly across best-in-class merchandising organisations.
1. Trigger off sell-through, not aged inventory
Weekly sell-through rate against a target curve is the leading indicator. Aged inventory reports are the lagging indicator. Teams that trigger markdowns off sell-through catch the miss 3 to 4 weeks earlier than teams that wait for aged-inventory alerts. Those 3 to 4 weeks translate into shallower markdown depth and materially better margin outcomes.
2. Take shallower depth earlier rather than deeper depth later
A 15 to 20 percent markdown at week 5 typically clears the same volume of inventory as a 35 to 45 percent markdown at week 9, but at roughly half the margin cost per unit. This is the arithmetic behind the "sooner and shallower" merchandising philosophy that best-in-class retailers preach to first-year buyers.
3. Size depth by SKU class, not by category
A single category markdown depth applied across every SKU wastes margin on A-class items that would have cleared at shallower depth, and under-clears C-class items that need deeper action. Run ABC classification and set depth by class. A-class SKUs often clear at 15 to 20 percent depth. B-class at 20 to 30 percent. C-class at 30 to 50 percent depending on ageing.
4. Layer promotions before deeper markdowns
Before committing to a second markdown depth, layer a targeted promotion. Email offer to loyalty members, bundle promotion, buy-one-get-one on adjacent SKUs, member-only weekend event. Promotions preserve ticket integrity for full-price customers while pulling velocity from price-sensitive segments. If promotion does not close the sell-through gap within 10 to 14 days, then trigger the deeper markdown.
5. Coordinate markdown timing with newness landing
Markdowns clear space for new arrivals. Newness drives traffic. Retailers who coordinate the two so that markdown clearance runs one to two weeks ahead of newness landing get the double benefit: the clearance traffic converts on the new arrivals, and the new arrivals refresh the category without inventory overhang.
6. Protect A-class SKUs from blanket markdown decisions
The temptation in a soft category is to markdown the entire assortment. A-class SKUs almost always keep selling at full price even when the rest of the category is soft, because they are top sellers for a reason. Marking down A-class inventory during a category softness surrenders margin without needing to. Run the Sell-Through Rate Calculator by SKU before applying a blanket depth.
Common pricing mistakes
Five markdown mistakes show up repeatedly across first and second-year merchandising teams.
| Mistake | Symptom | Fix |
|---|---|---|
| Using markdown price as the denominator | Reported markdown percent is inflated 30 to 50 percent above reality | Always use ORIGINAL selling price as denominator |
| Waiting for aged inventory reports to trigger action | Markdowns fire 3 to 4 weeks late, depth 2 to 3x higher than needed | Trigger off weekly sell-through against target curve |
| Applying blanket depth across a category | Margin wasted on A items, C items still not clearing | Set depth by ABC class or SKU-level velocity |
| Confusing markdown with discount | P&L reconciliation problems, mixed customer messaging | Permanent price change = markdown. Temporary = discount. Track separately. |
| Celebrating high markdown dollars | Team thinks activity is progress, but reactive markdowns are eating margin | Separate planned markdown dollars (absorbed) from unplanned (margin shortfall) |
The five markdown mistakes that quietly cost real margin dollars across a season. Fixing any two of them typically lifts category-level annual gross margin by 1.5 to 3 percentage points.
Industry benchmarks
Markdown intensity varies dramatically by retail vertical, business model and price positioning. Below are directional ranges observed across mainstream retail. Benchmark against direct competitors in the same vertical and format, not cross-category averages.
| Vertical / Format | Markdown as % of Net Sales | Notes |
|---|---|---|
| Fast fashion (apparel) | 30-45% | High markdown model built into buy plan; short seasons, aggressive cadence |
| Mainstream apparel | 15-25% | Standard 10-13 week seasons; planned markdown at 70% sell-through trigger |
| Off-price / discount | 5-12% | Low structural markdown; opportunistic buys designed to clear at full ticket |
| Home decor and accessories | 10-20% | Longer selling windows, carryover common on evergreen SKUs |
| Consumer electronics (mainstream) | 8-15% | Higher on end-of-life SKUs; near-zero on launch window |
| Furniture and big-ticket home | 5-12% | Long selling windows, low markdown intensity, high ticket |
| Health and beauty | 8-15% | Short-cycle promotions drive most activity; markdown on trend miss SKUs |
| Grocery and consumables | <2% | Shelf-life driven; markdown reserved for perishables and clearance corners |
| Luxury and premium | <8% | Tight markdown discipline; heritage brands and clienteling protect ticket |
| Toys and seasonal categories | 15-25% | Holiday concentration produces heavy January clearance |
Approximate markdown dollars as a percent of net sales, by retail vertical. Benchmark against direct competitors in the same vertical and price positioning.
Best practices
Six operating disciplines separate retailers who manage markdowns on purpose from retailers who are managed by them.
- Plan markdown dollars into the initial open-to-buy. Best-in-class targets 60 to 75 percent of expected annual markdown dollars absorbed by initial ticket structure.
- Track weekly sell-through against a target curve, not against a single-point benchmark. The curve catches pacing problems 2 to 3 weeks earlier than a snapshot comparison.
- Trigger the first markdown when actual sell-through falls 10 to 15 percentage points below the target curve at any milestone (25 percent, 50 percent, 75 percent of the season).
- Size depth by SKU class through ABC analysis, not by blanket category depth.
- Preserve ticket integrity on A-class SKUs. Blanket markdowns on top sellers surrender margin on inventory that would have cleared at full price.
- Review markdown effectiveness monthly at the category level. Track the ratio of planned to unplanned markdown dollars. Rising unplanned ratio signals a buying-process problem, not a markdown problem.
Frequently asked questions
The rapid-fire answers below cover the questions that come up most often in merchandising and buying meetings when markdown decisions are being sized. For deeper walk-throughs of specific calculations, use the Markdown Calculator which handles the full computation including optional cost input for post-markdown margin analysis.
How often should markdowns be reviewed?
Weekly at the SKU level for A-class items, category level for B and C. Monthly summary review at the merchandising leadership level. Quarterly deep-dive review of markdown effectiveness against plan.
What is the difference between markdown percent and margin loss?
A 33 percent markdown does not translate into 33 percentage points of margin loss. On a $120 ticket with $55 cost, a 33 percent markdown reduces the price to $80. Gross margin falls from 54.2 percent to 31.2 percent, a 23-point margin loss. The ratio depends on the initial margin structure. Higher-margin categories absorb the same markdown percent with less margin damage than lower-margin categories.
Can markdowns be a positive signal?
Yes, when they trigger against sell-through data and clear inventory ahead of a category refresh, markdowns are one of the highest-productivity levers in retail merchandising. The negative signal is not the markdown itself but rather the pattern of reactive, panicked markdowns fired too late, at too much depth, on inventory that should not have been bought in that quantity in the first place.
How does markdown connect to GMROI?
Every markdown reduces the gross profit numerator in GMROI. But a well-timed markdown that clears inventory faster also reduces the average inventory denominator, which lifts turnover. Whether GMROI ends the year higher or lower depends on which effect dominates. Proactive markdowns triggered off sell-through misses usually lift GMROI. Reactive clearance events usually pull GMROI down because the depth is too aggressive.
Key takeaways
Markdowns are a management tool, not an embarrassment. The retailers who deliver clean margin against plan year after year are not the ones who avoid markdowns. They are the ones who plan them, trigger them off leading indicators, size them by SKU class, and integrate them with newness cadence and open-to-buy discipline.
Six operating disciplines produce the best markdown outcomes. Plan 60 to 75 percent of expected markdown dollars into the initial buy. Track weekly sell-through against a target curve. Trigger the first markdown when actual falls 10 to 15 points below curve. Size depth by SKU class. Protect A-class ticket integrity. Review effectiveness monthly and track the planned-to-unplanned ratio.
The single most valuable behavioural change most merchandising teams can make is to shift from aged-inventory-triggered markdowns to sell-through-triggered markdowns. That single shift typically compresses average markdown depth by 8 to 15 percentage points and lifts category annual gross margin by 1.5 to 3 percentage points, with no other change to the buying process.
Use the Markdown Calculator to size specific markdown decisions with the correct arithmetic and to see post-markdown margin when cost is entered. Pair it with the Sell-Through Rate Calculator to trigger action off weekly pacing data, the Gross Margin Calculator to sanity-check margin impact, and the GMROI Calculator to confirm the year-end productivity effect. Read together, these four calculators cover the full markdown decision loop from trigger to sizing to margin impact to inventory productivity.
Frequently Asked Questions
What is a markdown in retail?+
A markdown is a permanent reduction of the ticket price of merchandise, taken against gross margin at the point of sale. It differs from a temporary promotion (where the ticket returns to original after the event) in that the new price becomes the working shelf price. Markdowns are the second-largest controllable line item on the retail P&L after cost of goods sold. Use the Markdown Calculator to size specific markdown decisions.
How do I calculate markdown percentage?+
Markdown % = ((Original Selling Price − Markdown Price) ÷ Original Selling Price) × 100. Always use the ORIGINAL selling price as the denominator. Using the markdown price is the most common first-year buyer mistake and produces numbers that will not reconcile against finance.
What is the difference between markdown and discount?+
A markdown is a permanent ticket reduction. A discount is a temporary promotional price with the ticket returning to original afterward. In P&L terms, markdowns show up as direct margin reduction on the SKU. Discounts show up as promotion expense or contra-revenue. Buyers and merchandisers use markdown language. Store operators and marketing teams use discount language.
What is the difference between markdown and markup?+
Markup is the percentage ADDED to cost to reach the selling price at the buy. Markdown is the percentage TAKEN OFF the selling price later in the season. Every SKU has a markup at the buy and (potentially) a markdown at end of season. The Gross Margin vs Markup Guide covers the pricing math in depth.
What is a healthy markdown rate for retail?+
It varies dramatically by vertical. Fast fashion: 30 to 45 percent of net sales. Mainstream apparel: 15 to 25 percent. Home decor: 10 to 20 percent. Consumer electronics: 8 to 15 percent. Grocery and consumables: under 2 percent. Luxury: under 8 percent. Benchmark against direct competitors in the same vertical and format.
When should I trigger a markdown?+
Weekly sell-through rate against a target curve is the primary trigger. When actual STR sits 10 to 15 percentage points below the curve at any milestone (25 percent, 50 percent, 75 percent of the season), most category managers trigger the first markdown. Waiting for aged inventory reports to force action almost always costs 2 to 3 times the margin points that earlier action would have cost.
How does markdown affect gross margin?+
A markdown reduces the selling price but leaves the cost side unchanged, so it directly compresses gross profit dollars and gross margin percent. On a $120 ticket with $55 cost, pre-markdown margin is 54.2 percent. Mark to $80 and post-markdown margin is 31.2 percent. That is 23 percentage points of margin compression. The Gross Margin Calculator shows the full impact.
What is the difference between planned and unplanned markdown?+
A planned markdown is built into the seasonal open-to-buy at PO time. The buyer prices the initial ticket knowing a fraction of the buy will need to clear at reduced margin. An unplanned markdown is a reactive response to a sell-through miss that was not in the plan. Best-in-class retailers plan 60 to 75 percent of annual markdown dollars into the initial buy.
How does markdown connect to GMROI?+
GMROI is gross profit per inventory dollar. Every markdown reduces gross profit, which drags GMROI down. But a well-timed markdown also clears inventory faster, which reduces the denominator and lifts turnover. Whether GMROI moves up or down depends on which effect dominates. Proactive markdowns usually lift GMROI. Reactive clearance events usually pull it down.
What are the most common markdown mistakes?+
Five repeat across teams. Using markdown price as the denominator instead of original. Waiting for aged inventory to trigger action instead of sell-through. Applying blanket depth across a category instead of by SKU class. Confusing markdown with discount in P&L reporting. And celebrating high markdown dollars without separating planned from unplanned. The Markdown Calculator uses the correct denominator and returns interpretation plus practical recommendations to avoid each mistake.
Related Calculators
Try the math from this guide with our free tools.
Markdown Calculator
The pricing tool every buyer and merchandiser reaches for when inventory is running behind sell-through pace. Out comes the markdown amount, the markdown percent, the final selling price, and, once a cost is entered, the resulting gross profit and margin percent. It also flags whether the markdown depth is promotional, seasonal, aggressive or clearance-tier, and generates practical next-step recommendations tied to gross margin, GMROI, sell-through rate and inventory turnover. A markdown also changes the inventory value carried under the retail inventory method, so it is worth re-checking that ratio after a significant markdown event rather than waiting for the next period close.
Open calculator
Gross Margin Calculator
The cleanest read on how much of every sales dollar you actually keep after paying for the goods. Gross margin drives every downstream financial decision in retail: what to price, what to promote, what to keep on the shelf. Margin percent, the markup equivalent, cost as a percent of revenue and the price-to-cost multiplier all appear together, which is what it takes to translate between the three lenses without reaching for a second tool. The COGS input behind all of it depends on how inventory is valued in the first place, and a retailer using the retail inventory method will get a different COGS figure than one costing at actual unit cost, even from identical sales and purchase data.
Open calculator
Markup Calculator
Set a selling price from cost or reverse-engineer the markup baked into an existing price. Markup is the buyer’s language of pricing (percent added on top of cost), while margin is the finance language (percent kept from revenue). Alongside markup percent come profit per unit, the margin equivalent and the price-to-cost multiplier. Buying and finance can then argue about the price rather than about the denominator. Departments already running the retail inventory method calculator have a cost-to-retail ratio on hand, which doubles as a fast sanity check against the markup this page returns.
Open calculator
GMROI Calculator
The single most honest cross-category profitability metric in retail. GMROI answers one question: for every dollar of inventory you funded, how many dollars of gross profit did you get back? A high gross margin on inventory that never sells produces zero return, which is why GMROI keeps margin and inventory turnover honest against each other. The output is the GMROI ratio with gross margin percent, inventory turnover, gross profit and a plain-English performance band, because the ratio on its own tells a buyer very little.
Open calculator
Sell-Through Rate Calculator
The speed-of-sale metric every buyer, planner and category manager reads before touching pricing or reorder decisions. Sell-through rate measures the percent of received units that actually sold across the measurement window. High sell-through means the buy is working. Low sell-through means the inventory is aging faster than expected and the markdown clock is running. Enter units sold and units received and the STR percent arrives next to remaining units, weekly sell rate, and projected weeks to both 80 percent and 100 percent sell-through, with a plain-English band saying whether the buy is on pace. The point of the band is to be acted on, not filed.
Open calculator
Inventory Turnover Calculator
Measure how many times a year your average inventory sells through and gets replaced. The single most consequential operational KPI in retail. It connects buying decisions, warehouse cash, markdown risk, and finance targets into one number. The turn ratio arrives converted into days and weeks of supply, together with the working capital a one-turn improvement would release. Departments that carry stock at retail value rather than cost usually track it with a retail inventory method tracking template, which produces the same average-inventory figure this calculator needs.
Open calculator
Days Inventory Outstanding Calculator
Convert your inventory position into a number finance actually reads: the average days of cash sitting on the warehouse floor. DIO is the same measurement as inventory turnover in days instead of a ratio, and it maps directly onto working capital, cash conversion cycle and reorder cadence. Four numbers come out: DIO, weeks of supply, implied turnover, and the cash a 10-day improvement would release.
Open calculator
ABC Analysis Calculator
Paste a list of SKUs and their revenue and get an instant A / B / C classification. Use the output to set service levels, safety stock, and buying priority the way experienced planners do.
Open calculator
Related Articles
Sell-Through Rate Explained: The Buyer’s Speed-of-Sale Metric
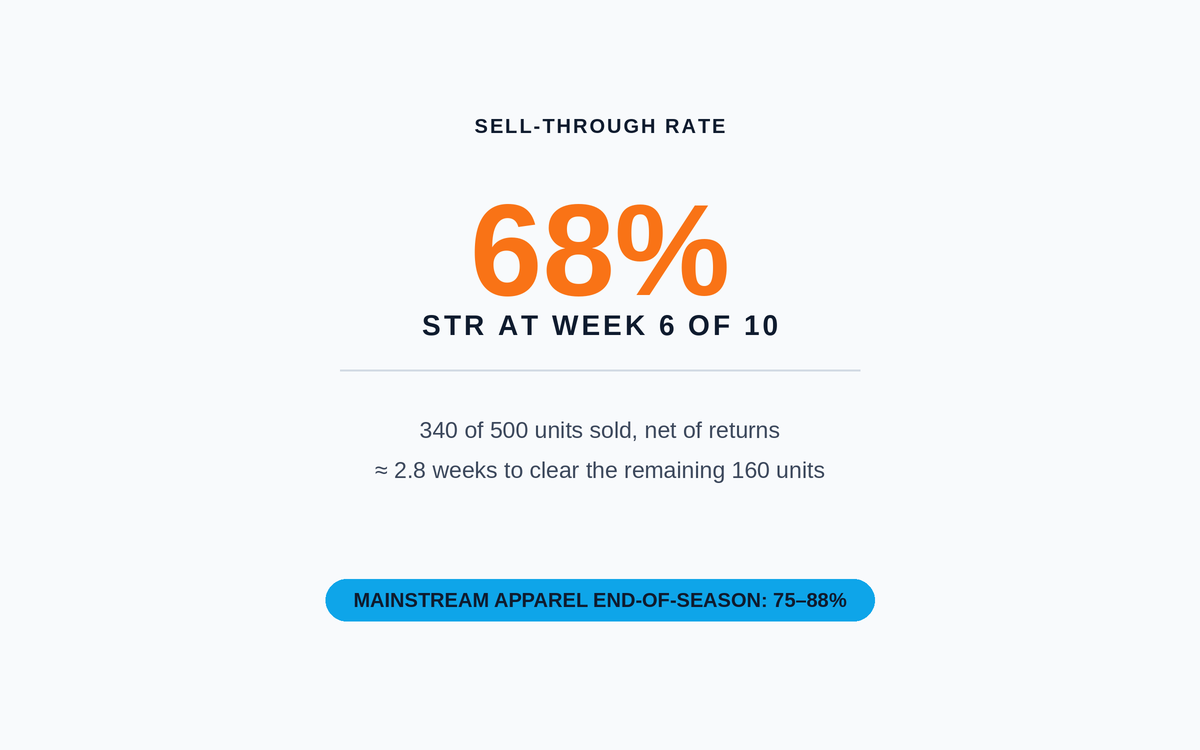
The leading indicator every seasonal buyer reads weekly. How to compute STR the right way, plot it against a target curve, and use it to catch over-buying before it turns into aged inventory.
GMROI Explained: The Cornerstone Profitability Metric for Retail Buyers
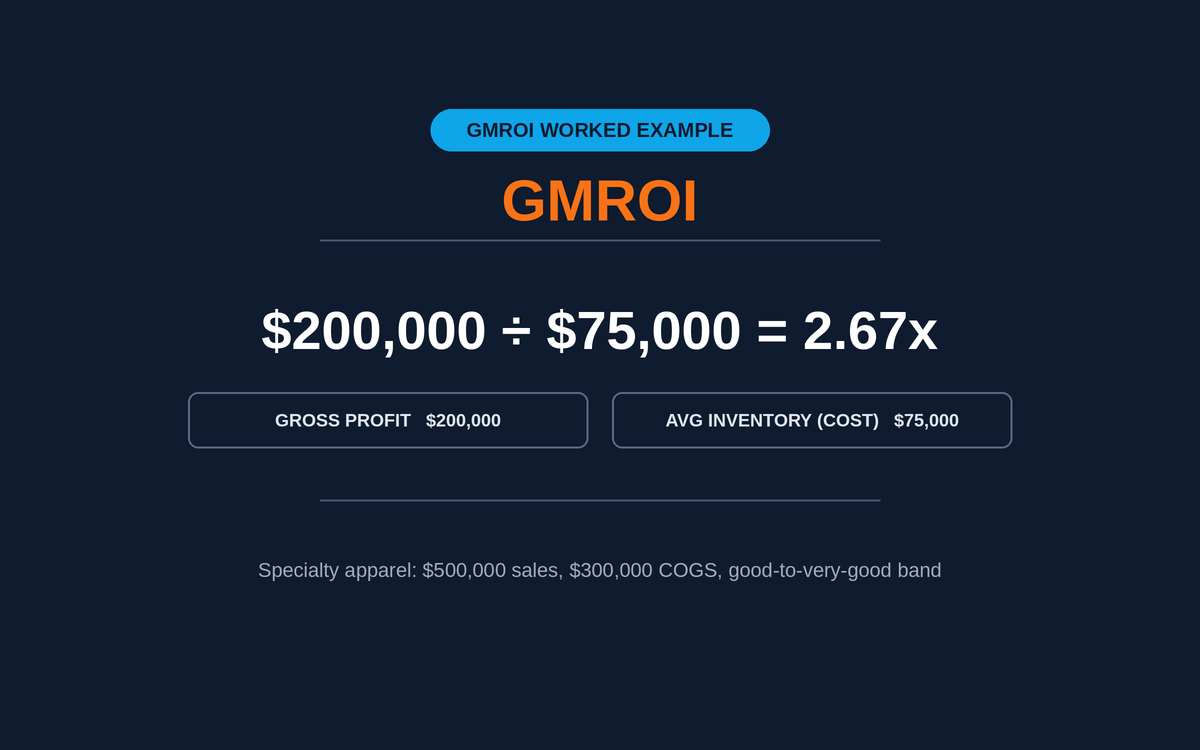
The most honest profitability metric in retail. How buyers and category managers actually use GMROI to make cross-category assortment, pricing and open-to-buy decisions.
Margin vs Markup in Retail Math
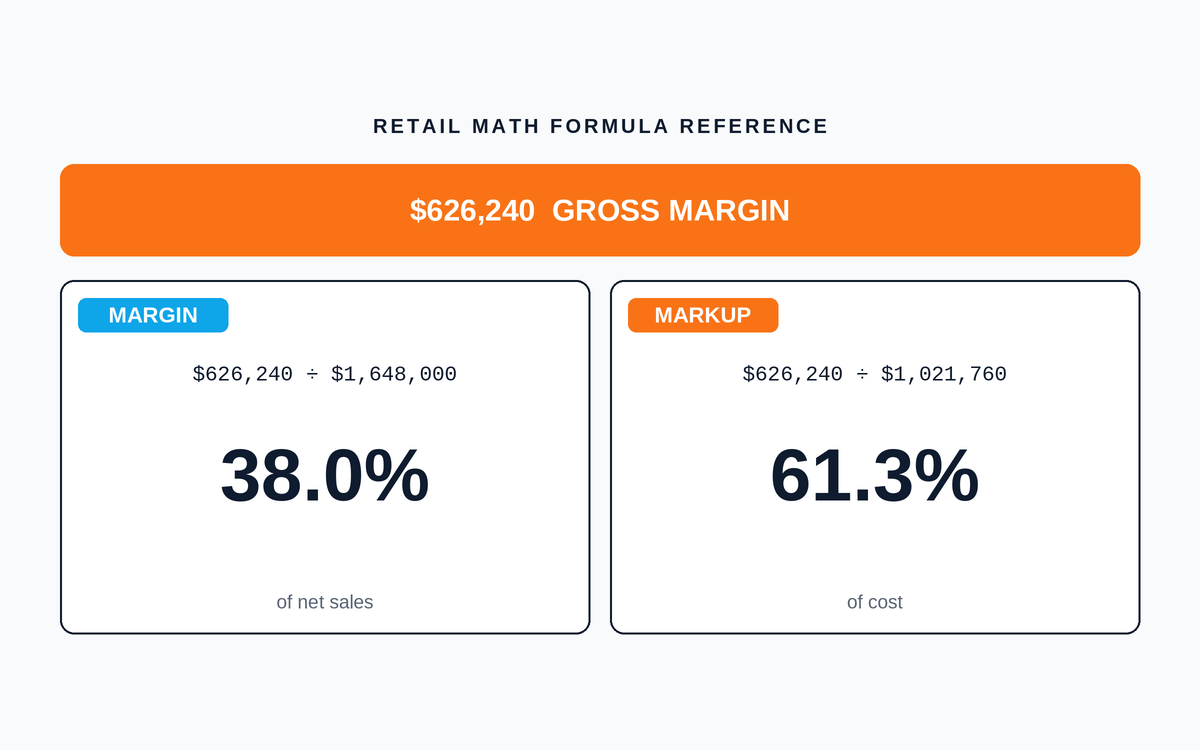
A buyer and a controller report different margins on the same category and both are right. Where the two conventions came from, which metrics mislead and when, and how to decide which number has authority.
Explore Related Resources
Handpicked benchmarks, templates and guides to help you dig deeper.