Sell-Through Rate Explained: The Buyer’s Speed-of-Sale Metric
The leading indicator every seasonal buyer reads weekly. How to compute STR the right way, plot it against a target curve, and use it to catch over-buying before it turns into aged inventory.
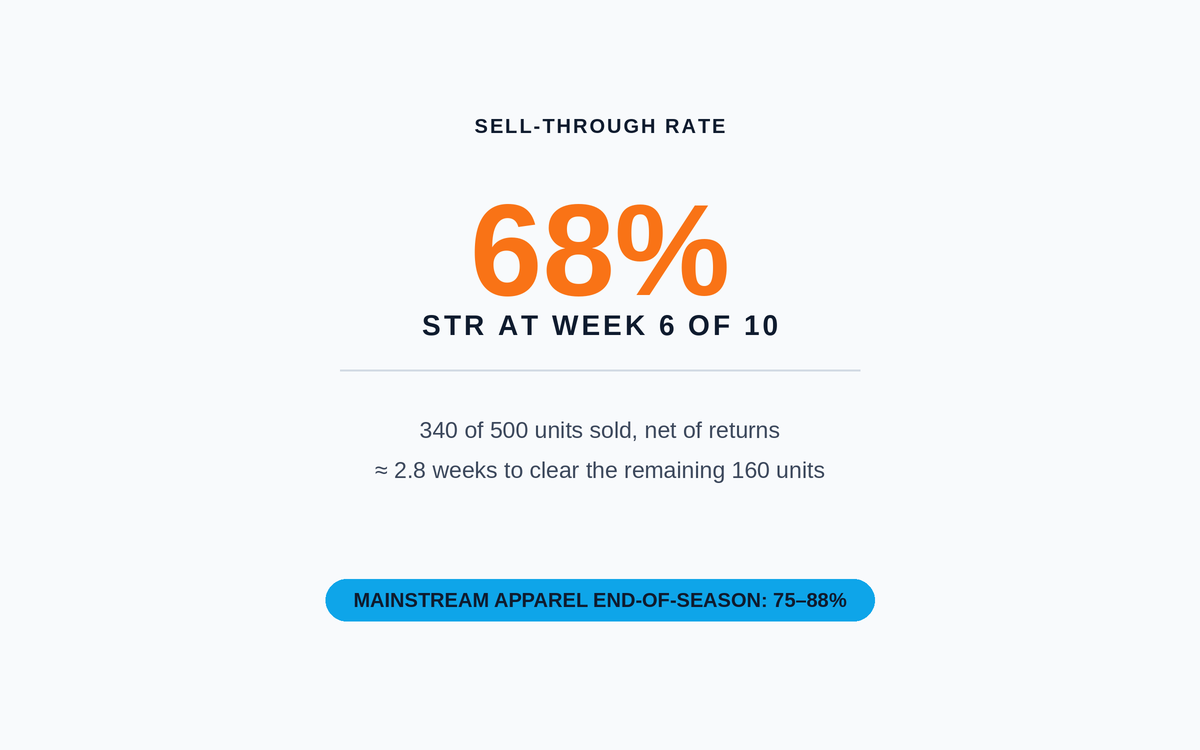
Table of contents+
- What sell-through rate actually measures
- The formula (and the two inputs that must be right)
- Full worked example
- Target STR curves by season length
- Category benchmarks
- How STR triggers markdown timing
- When high sell-through is actually bad
- How sell-through connects to the rest of the cluster
- Common sell-through mistakes
- A three-question weekly framework
- Templates and cross-references
- Summary
Every experienced buyer eventually learns to read a sell-through report the way a captain reads a barometer. The number itself matters less than the direction it is moving and whether the pace against the season target is honest or comforting. STR is the leading indicator that catches over-buying and pricing errors at week 4 or 6 of a 10-week season, long before the end-of-season markdown report tells the story in dollars. Retailers who report STR only at end of season are running the business on a lagging metric. Retailers who plot STR weekly against a target curve are running the business on a leading one.
Most of the damage happens in the gap between computing the number and acting on it. What STR measures. The formula and the two inputs that get botched most often. A full worked example with three what-if scenarios. Target STR curves by season length. Category benchmarks. How STR triggers markdown timing. How it connects to GMROI, inventory turnover, markup and gross margin. And the four mistakes that turn a useful leading indicator into a misleading snapshot.
What sell-through rate actually measures
Sell-through rate is the percent of units received that have actually sold across the measurement window. A 68 percent STR at week 6 of an 8-week window means 68 percent of the committed buy is already in customer hands and 32 percent still sits on the shelf. Higher is better, but only against a target curve, and only when the number is not hiding stockouts on top sellers.
The reason STR sits above turnover in the buyer’s weekly review pack is timing. Turnover is an annualized ratio computed against COGS. Its earliest useful signal is a full quarter into the year. STR is a unit-side percent computed against physical receipts, and it produces a useful signal at week 2 of the season. Buyers who wait for turnover to tell them the buy is off are already a season behind the retailers who read STR weekly.
Sell-through is a curve, not a snapshot. A 40 percent STR at week 2 is ahead of pace. A 40 percent STR at week 8 is a markdown emergency. Same number, opposite meaning. Read STR against a weekly target curve, not against a category-average number.
The formula (and the two inputs that must be right)
The math is trivial.
Sell-Through Rate % = (Units Sold ÷ Units Received) × 100
Units Sold is net of returns for the measurement window. Units Received is total physical receipts booked into stock during the window, including all mid-period POs, not just the opening ATS (available-to-sell). Retailers who compute STR against opening ATS while ignoring later receipts systematically overstate sell-through, mask over-buying, and get blindsided when weeks-of-supply metrics start climbing.
One common variation reports STR against opening stock plus receipts (a running-total denominator). Another reports STR against total committed buy (season-total denominator). Both are valid as long as everyone in the pricing meeting is using the same denominator. The failure mode is a buyer reporting STR against opening ATS while finance reports it against total buy, and both sides thinking they agree on a number that describes very different realities. Pick one denominator, publish it in the definitions doc, and hold every category to the same standard. The Sell-Through Rate Calculator reports the percent alongside remaining units, weekly sell rate, projected weeks to 80 and 100 percent sell-through, and a plain-English performance band.
Full worked example
A specialty apparel buyer commits to 500 units of a summer denim style. The season runs 10 weeks. At the end of week 6, POS reports 340 units sold net of returns. Sell-Through Rate = (340 / 500) × 100 = 68 percent. Remaining units = 160. Weekly sell rate = 340 / 6 ≈ 56.7 units per week. Projected weeks to 100 percent sell-through at current pace = 160 / 56.7 ≈ 2.8 weeks, which fits inside the remaining 4-week window. This is a healthy, on-pace buy that does not need intervention.
Three what-if scenarios show what actually moves STR in practice.
Velocity slows to 30 units per week from week 7
A competitor drops price mid-season. Weekly sell rate drops from 56.7 to 30 units per week. Remaining 160 units now take 160 / 30 ≈ 5.3 weeks, which overshoots the 4-week season window by more than a week. The buyer has hit the trigger point for a strategic markdown at week 7 instead of waiting for a reactive one at week 10. The Markdown Calculator sizes the price move once STR triggers the decision.
Targeted markdown lifts velocity to 65 units per week
Buyer applies a 15 percent markdown at week 7. Weekly sell rate climbs from 56.7 to 65 units per week. Remaining 160 units now clear in 160 / 65 ≈ 2.5 weeks, closing cleanly at end of season. This is the arithmetic that makes proactive markdowns cheaper than reactive clearance events. A 15 percent markdown taken at week 7 preserves 85 percent of the margin on the remaining units. A 40 percent clearance event at week 11 preserves 60 percent. Same units cleared, very different margin outcomes.
Buyer over-commits by 50 percent
Same demand profile but the initial buy is 750 units instead of 500. Week 6 sell-through = 340 / 750 = 45.3 percent. Remaining = 410 units. At the same 56.7 weekly sell rate, weeks to full sell-through = 410 / 56.7 ≈ 7.2 weeks. The season ends in 4 weeks. This buy is roughly 240 units over-committed and heading straight for end-of-season clearance. STR caught the over-buy at week 6 instead of week 10. That single insight is the reason STR sits at the top of every serious buyer’s weekly review pack.
Target STR curves by season length
The single most useful discipline in STR management is plotting weekly actual STR against a weekly target curve. The target is not linear because seasonal demand rarely is. Newness peaks in the first third of the season. End of season is markdown territory. The curves below are starting points, calibrated for typical seasonal apparel and softlines behavior. Adjust for category-specific curves before finalizing planning targets.
| Season Length | Week 25% target | Week 50% target | Week 75% target | End-of-season target |
|---|---|---|---|---|
| 8-week season | 22% by wk 2 | 48% by wk 4 | 72% by wk 6 | 92% by wk 8 |
| 10-week season | 20% by wk 2-3 | 45% by wk 5 | 70% by wk 7-8 | 90% by wk 10 |
| 13-week season | 18% by wk 3 | 42% by wk 6-7 | 68% by wk 9-10 | 88% by wk 13 |
| 16-week season | 15% by wk 4 | 40% by wk 8 | 65% by wk 12 | 85% by wk 16 |
Target STR curves front-load velocity to reflect newness peak. Actuals more than 10 percentage points below the curve at any milestone typically trigger the first markdown review.
Category benchmarks
End-of-season sell-through varies by category structure, seasonality intensity and typical assortment carryover strategy.
| Category | Typical Full-Price EoS STR | Notes |
|---|---|---|
| Fast fashion (apparel) | 85% to 95% | Short seasons, aggressive markdown cadence, low carryover tolerance |
| Mainstream apparel | 75% to 88% | Standard 10 to 13 week seasons, planned markdown at 70 percent trigger |
| Home decor and accessories | 60% to 80% | Longer selling windows, carryover common on evergreen SKUs |
| Consumer electronics (new launches) | 80% to 92% | Launch window is 8 to 12 weeks; carryover tolerated on non-hero SKUs |
| Grocery and consumables | 95%+ weekly | Shelf life driven; STR reported weekly, not seasonally |
| Furniture and big-ticket home | 55% to 75% | Long selling windows, carryover normal on non-trend SKUs |
| Health and beauty | 85% to 95% | Short-cycle promotions drive most SKUs; slow SKUs pruned via ABC |
Approximate end-of-season sell-through benchmarks by retail vertical. Benchmark against direct competitors in the same category and season structure, not cross-category averages.
How STR triggers markdown timing
The most consequential downstream decision STR drives is markdown timing. Weekly STR against the target curve is the primary trigger.
- Actual STR sits within 5 percentage points of the target curve: no action. Buy is on pace.
- Actual STR sits 5 to 10 points below the target curve for two consecutive weeks: schedule the first markdown review. Do not markdown yet, but pre-position for it.
- Actual STR sits 10 to 15 points below the target curve at any milestone (25 percent, 50 percent, 75 percent): trigger the first markdown. Typical first-markdown depth is 10 to 20 percent depending on category.
- Actual STR remains below curve two weeks after the first markdown: trigger the second markdown, usually 25 to 40 percent depth.
- End of season approaches with actual STR still below target: trigger clearance at 40 percent-plus depth.
The Markdown Calculator sizes the price move once the STR trigger has been hit. Delaying markdowns because STR looks acceptable in absolute terms (without checking against the curve) is one of the most expensive mistakes in seasonal buying, because every extra week of carry compounds the eventual markdown depth needed to clear.
When high sell-through is actually bad
The failure mode that gets underweighted in first-year buying: STR near 100 percent well before season end almost always means the buy was too small and top-sellers stocked out. Lost sales hide behind the flattering number because sales that never happened never appear in the units-sold numerator. The finance dashboard celebrates 95 percent STR at week 8 while the store loses top-seller customers who found empty shelves at week 5.
The guardrail is to never read STR in isolation. Pair it with in-stock percent at the SKU level, especially for A-class items. A 95 percent season STR with 8 percent stockouts on top-decile SKUs is a worse operating outcome than 85 percent STR with 0.5 percent stockouts. Run ABC classification to identify which SKUs need stockout monitoring, and size safety stock through the Safety Stock Calculator rather than reactively cutting reorder quantities to chase STR.
How sell-through connects to the rest of the cluster
Sell-through is the operational lever. Every other retail-finance metric downstream is a financial outcome of what STR was measuring in real time.
STR and GMROI. GMROI is the year-end profitability-per-inventory-dollar view. Categories that consistently miss STR targets end up with lower turnover and higher markdown pressure, both of which pull GMROI down. Optimizing weekly STR is one of the cleanest paths to lifting GMROI without touching supplier terms.
STR and gross margin. Every point of margin lost to markdowns triggered by low STR shows up in the P&L six weeks later. Late markdowns cost 5 to 15 percentage points of margin compared to timely ones.
STR and markup. Higher markup at the buy compresses initial STR because the price is above the market’s comfortable clearing level. Lower markup accelerates STR but leaves margin on the table. Getting markup right at the buy is the single biggest determinant of downstream STR curve shape.
STR and inventory turnover. Consistent above-target STR quarter after quarter shows up as strong annual turnover. Consistent below-target STR shows up as sluggish turnover and rising DIO.
STR and DIO. DIO is turnover in days. Same relationship. Persistent STR shortfalls lift DIO because the residual inventory sits on the shelf longer before clearance.
STR and ABC classification. Read STR by ABC class, not just by category. A-class SKUs should hit target curves cleanly. C-class SKUs often lag on purpose because they exist for assortment breadth. A single category STR number obscures wildly different reality by class.
Common sell-through mistakes
Four failures show up repeatedly across first and second-year buyer teams.
| Mistake | Symptom | Fix |
|---|---|---|
| STR against opening ATS only | STR inflated 8 to 15 percentage points, over-buying hidden | Compute against running-total receipts including mid-season POs |
| Single-point STR reporting | Pacing problems invisible, markdown timing reactive not proactive | Plot weekly STR against a target curve; report the delta, not the absolute number |
| Mixing unit and dollar STR | Contradictory conclusions in the same pricing meeting | Pick one denominator, publish the definition, hold every category to it |
| Celebrating STR without stockout check | High STR from inventory starvation looks like a win | Pair STR with in-stock percent, especially on A-class SKUs |
Four failure modes that turn STR from a leading indicator into a misleading snapshot.
A three-question weekly framework
Before acting on any weekly STR number, ask three questions.
- Where does actual STR sit versus the target curve at this specific week? A single-point number is meaningless without pacing context.
- What is the in-stock status on A-class SKUs? High STR from stockouts is not a win. Pair the number with a stockout check.
- What is the projected weeks-to-100-percent at current velocity? If it overshoots the season window by more than 10 percent, trigger the markdown timing review now, not next week.
Templates and cross-references
For live sell-through monitoring across a season, the Inventory Management Tracker (Excel) has an STR column that computes weekly sell-through against opening ATS and running-total receipts. The Retail KPI Cheat Sheet shows where STR sits alongside conversion, ATV, UPT and labor cost percent in a category manager’s weekly review pack. The Retail KPI Guide covers the full KPI hierarchy for a store or category team.
Summary
Sell-through rate is the leading indicator every serious buyer reads weekly, because it catches over-buying and pricing errors at week 4 or 6 of a season instead of at the end-of-season markdown report. It works when units sold is net of returns, when units received is running-total physical receipts including mid-season POs, when the number gets plotted against a weekly target curve rather than reported as a single point, and when it is paired with A-class stockout data to guard against inventory-starvation false positives. It becomes misleading when opening ATS gets used as the denominator while mid-season receipts are ignored, when a single-point number gets reported without pacing context, when unit STR and dollar STR get mixed inside the same conversation, and when high STR from stockouts gets celebrated as merchandising success. Used correctly alongside GMROI, gross margin, markup, inventory turnover, DIO and ABC classification, STR becomes the earliest available signal that separates disciplined seasonal buying from reactive clearance management. Run the Sell-Through Rate Calculator to see STR alongside remaining units, weekly sell rate, projected weeks to full sell-through and a plain-English performance band for your own numbers.
Frequently Asked Questions
What is a good sell-through rate in retail?+
It depends on the length of the selling window. For a full 10 to 13 week season, 80 to 95 percent full-price sell-through is strong. Below 60 percent by end of season usually forces markdown. For weekly reporting, benchmark against a target curve that reaches 80 percent by the last 20 percent of the window rather than against a category-average number. The Sell-Through Rate Calculator reports STR alongside remaining units and projected weeks to full sell-through.
What is the difference between sell-through and inventory turnover?+
STR is a percent (units sold divided by units received) over a specific window, typically weeks to a season. Inventory turnover is a ratio (COGS divided by average inventory) over a full year. STR is the leading indicator that catches over-buying at week 4 or 6. Turnover is the lagging confirmation that shows up at year end. Read both. STR triggers action. Turnover reports outcomes.
Should sell-through be measured in units or dollars?+
Units, not dollars. STR is a unit-side metric on purpose because dollar-side sell-through gets distorted by mid-season price changes. If you want the dollar view for finance reporting, compute weighted average selling price separately and report both alongside STR. Never mix them into a single number and never let one team report units while another reports dollars.
How is sell-through used in vendor scorecards?+
Wholesale and franchise-driven retail models often push STR back to suppliers as a vendor scorecard metric. Low STR on a supplier’s SKUs signals over-buying pressure from the vendor side or forecast optimism the buyer accepted. Formal vendor scorecards typically weight STR at 20 to 30 percent alongside on-time delivery, fill rate and OTIF.
How does sell-through trigger markdown decisions?+
Weekly STR against a target curve is the primary trigger. When actual sits 10 to 15 percentage points below the curve at any milestone (25, 50 or 75 percent), most category managers trigger the first markdown. When actual remains below curve two weeks after the first markdown, a second markdown fires. The Markdown Calculator does the price math once STR has hit the trigger.
What is a healthy weekly sell-through target?+
For a 10-week season, average 8 to 10 percent per week front-loaded (higher in weeks 1 to 4, lower in weeks 8 to 10). For a 13-week season, average 6 to 8 percent per week. The target curve should not be linear because seasonal demand rarely is. Newness peaks early. End of season is markdown territory. Plot the target as a curve and track weekly actual against it.
Can sell-through be too high?+
Yes. STR near 100 percent well before season end almost always means the buy was too small and top sellers stocked out. Lost sales hide behind the flattering number because sales that never happened never appear in the numerator. Always pair STR with in-stock percent on A-class SKUs. A 95 percent STR with 8 percent stockouts is worse than 85 percent with 0.5 percent stockouts.
How does sell-through connect to GMROI?+
GMROI is the annual profitability-per-inventory-dollar view. Categories that miss STR targets end up with lower turnover and higher markdown pressure, both of which drag GMROI down. STR is the operational lever. GMROI is the financial outcome. Optimizing STR by season is one of the cleanest paths to lifting GMROI without touching supplier terms.
What is the difference between sell-through and sell-in?+
Sell-in is what the buyer ordered from the supplier (units on the PO). Sell-through is what the customer bought from the retailer (units off the shelf). In wholesale terminology, sell-in is what the brand shipped into the retailer. Sell-through is what the retailer moved through to the consumer. Confusing the two produces very different negotiating positions on markdown allowance and reorder timing.
What are the most common sell-through mistakes?+
Four repeat across teams. Computing STR against opening ATS while ignoring mid-season receipts. Reporting a single-point number without a target curve. Mixing unit and dollar STR in the same conversation. And celebrating high STR without checking stockout data. The Sell-Through Rate Calculator uses running-total receipts by default and returns the pacing context needed to avoid each mistake.
Related Calculators
Try the math from this guide with our free tools.
Sell-Through Rate Calculator
The speed-of-sale metric every buyer, planner and category manager reads before touching pricing or reorder decisions. Sell-through rate measures the percent of received units that actually sold across the measurement window. High sell-through means the buy is working. Low sell-through means the inventory is aging faster than expected and the markdown clock is running. Enter units sold and units received and the STR percent arrives next to remaining units, weekly sell rate, and projected weeks to both 80 percent and 100 percent sell-through, with a plain-English band saying whether the buy is on pace. The point of the band is to be acted on, not filed.
Open calculator
GMROI Calculator
The single most honest cross-category profitability metric in retail. GMROI answers one question: for every dollar of inventory you funded, how many dollars of gross profit did you get back? A high gross margin on inventory that never sells produces zero return, which is why GMROI keeps margin and inventory turnover honest against each other. The output is the GMROI ratio with gross margin percent, inventory turnover, gross profit and a plain-English performance band, because the ratio on its own tells a buyer very little.
Open calculator
Markdown Calculator
The pricing tool every buyer and merchandiser reaches for when inventory is running behind sell-through pace. Out comes the markdown amount, the markdown percent, the final selling price, and, once a cost is entered, the resulting gross profit and margin percent. It also flags whether the markdown depth is promotional, seasonal, aggressive or clearance-tier, and generates practical next-step recommendations tied to gross margin, GMROI, sell-through rate and inventory turnover. A markdown also changes the inventory value carried under the retail inventory method, so it is worth re-checking that ratio after a significant markdown event rather than waiting for the next period close.
Open calculator
Gross Margin Calculator
The cleanest read on how much of every sales dollar you actually keep after paying for the goods. Gross margin drives every downstream financial decision in retail: what to price, what to promote, what to keep on the shelf. Margin percent, the markup equivalent, cost as a percent of revenue and the price-to-cost multiplier all appear together, which is what it takes to translate between the three lenses without reaching for a second tool. The COGS input behind all of it depends on how inventory is valued in the first place, and a retailer using the retail inventory method will get a different COGS figure than one costing at actual unit cost, even from identical sales and purchase data.
Open calculator
Markup Calculator
Set a selling price from cost or reverse-engineer the markup baked into an existing price. Markup is the buyer’s language of pricing (percent added on top of cost), while margin is the finance language (percent kept from revenue). Alongside markup percent come profit per unit, the margin equivalent and the price-to-cost multiplier. Buying and finance can then argue about the price rather than about the denominator. Departments already running the retail inventory method calculator have a cost-to-retail ratio on hand, which doubles as a fast sanity check against the markup this page returns.
Open calculator
Inventory Turnover Calculator
Measure how many times a year your average inventory sells through and gets replaced. The single most consequential operational KPI in retail. It connects buying decisions, warehouse cash, markdown risk, and finance targets into one number. The turn ratio arrives converted into days and weeks of supply, together with the working capital a one-turn improvement would release. Departments that carry stock at retail value rather than cost usually track it with a retail inventory method tracking template, which produces the same average-inventory figure this calculator needs.
Open calculator
Days Inventory Outstanding Calculator
Convert your inventory position into a number finance actually reads: the average days of cash sitting on the warehouse floor. DIO is the same measurement as inventory turnover in days instead of a ratio, and it maps directly onto working capital, cash conversion cycle and reorder cadence. Four numbers come out: DIO, weeks of supply, implied turnover, and the cash a 10-day improvement would release.
Open calculator
ABC Analysis Calculator
Paste a list of SKUs and their revenue and get an instant A / B / C classification. Use the output to set service levels, safety stock, and buying priority the way experienced planners do.
Open calculator
Related Articles
Markdown Pricing Explained: A Retail Operator’s Complete Guide
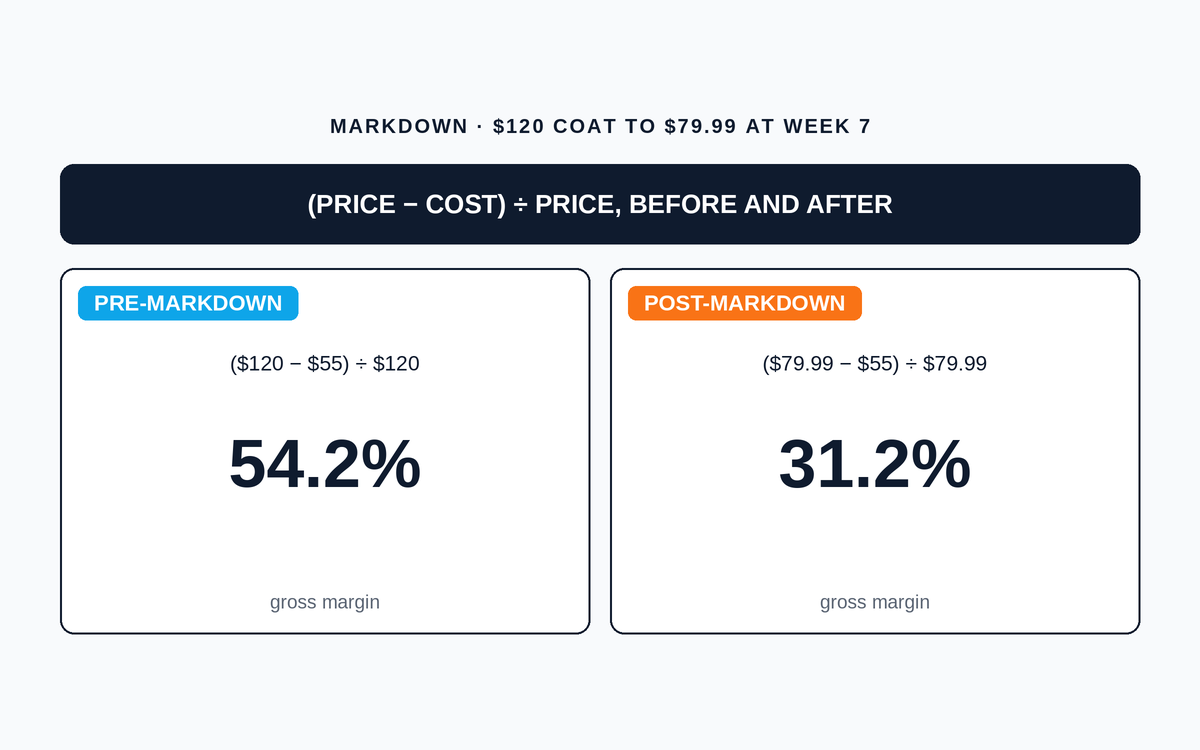
Everything a buyer, merchandiser or category manager needs to know about markdown pricing. When to trigger a markdown, how to size it, how it affects margin and GMROI, and the mistakes that quietly bleed working capital.
Open-to-Buy Planning: The Weekly Discipline That Keeps Buyers Honest
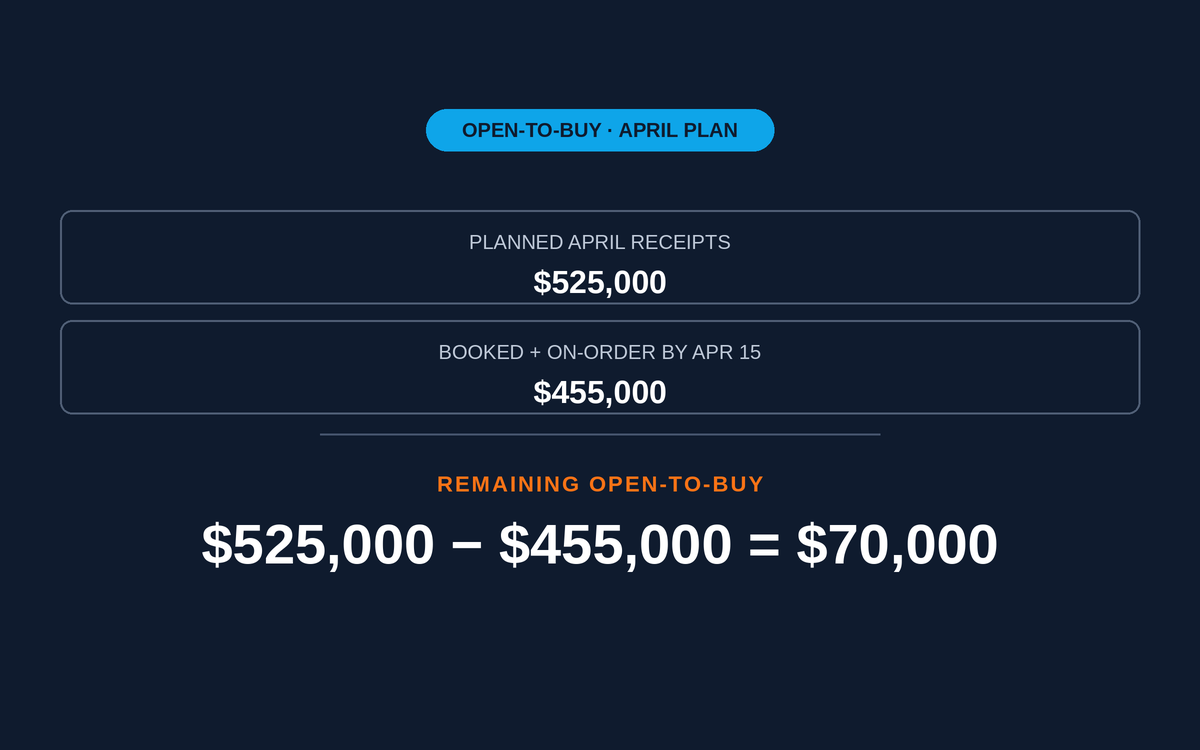
OTB is not a formula, it is a weekly self-imposed spending cap. How to compute it, run it, and use it to catch drift before it becomes a mid-season markdown emergency.
GMROI Explained: The Cornerstone Profitability Metric for Retail Buyers
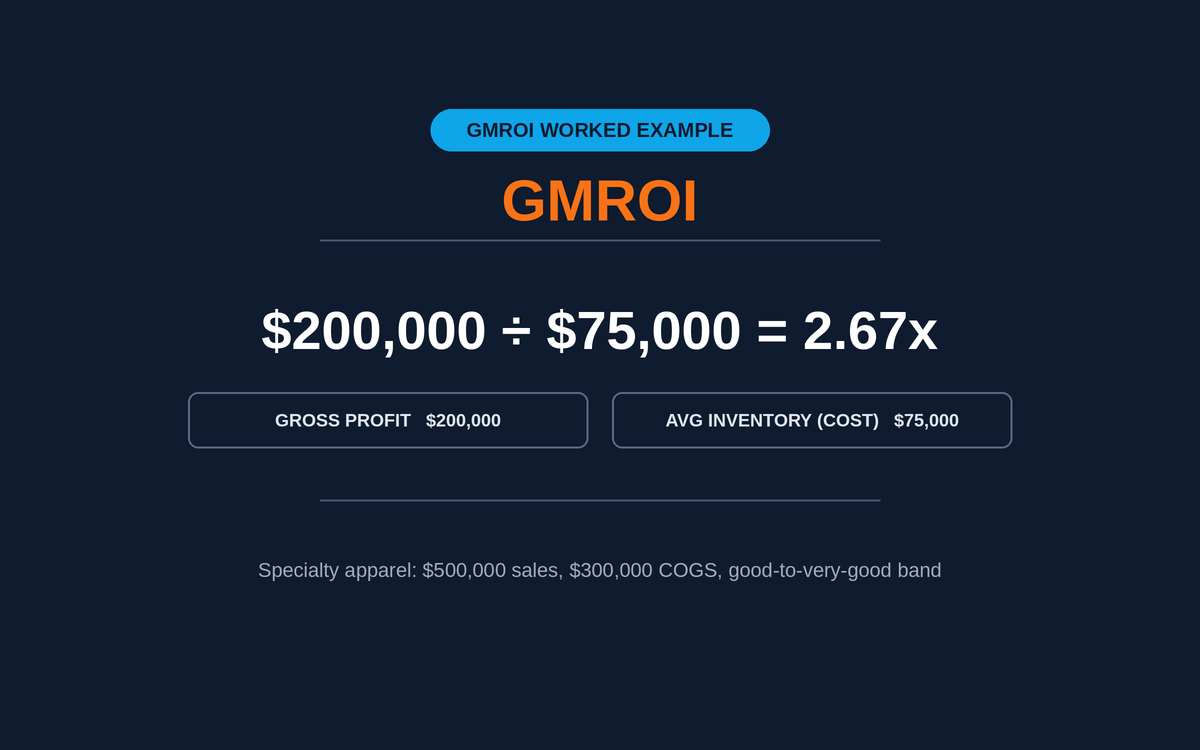
The most honest profitability metric in retail. How buyers and category managers actually use GMROI to make cross-category assortment, pricing and open-to-buy decisions.
Explore Related Resources
Handpicked benchmarks, templates and guides to help you dig deeper.