The Retail Inventory Method: Which Cost-to-Retail Ratio You Use Changes the Answer
Conventional, average cost and FIFO retail run the same inputs to different balance sheet values. What separates them, which retailers use which, and the blended-ratio mistake that costs more than the variant choice.
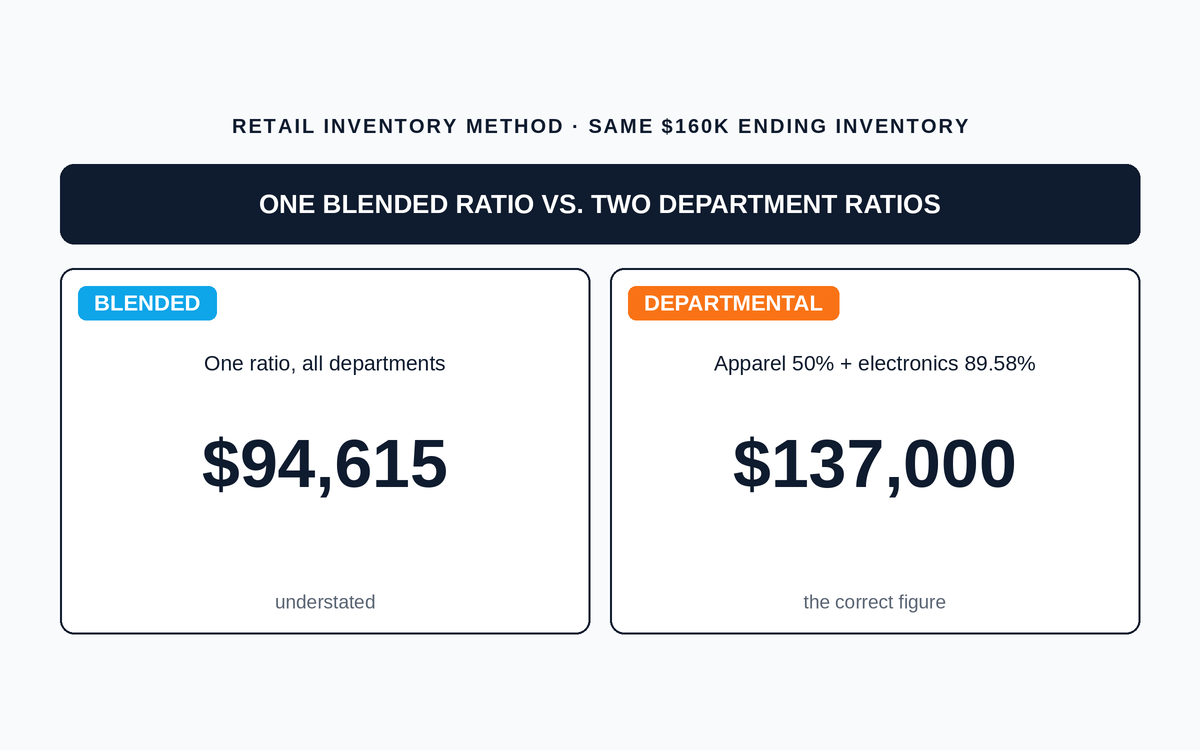
Table of contents+
- Why the method exists at all
- The three variants, and who uses which
- The number moves most when you are least able to think about it
- The mistake that costs more than the variant choice
- What the method tells you about shrink, and what it does not
- Why two large retailers left and most stayed
- When to stop using it
Somewhere in the notes to a retailer’s financial statements sits a sentence naming the method used to value inventory. It runs to about fifteen words. Nobody reads it. It quietly sets the carrying value of the single largest asset on the balance sheet, and for a large share of American retailers that sentence says some version of "inventories are valued at the lower of cost or market, cost being determined using the retail inventory method."
That sentence has three plausible completions, and they do not produce the same number.
The retail inventory method estimates ending inventory at cost by applying a cost-to-retail ratio to inventory valued at retail prices. Its three standard variants differ only in how the ratio’s denominator is built: the conventional variant excludes net markdowns, the average cost variant includes them, and FIFO retail includes them while excluding beginning inventory. Identical inputs run through different variants produce materially different balance sheet values.
Why the method exists at all
The retail method was not invented to be clever. It was invented because counting a department store’s inventory at cost was physically impossible at any reasonable frequency. A store carrying two hundred thousand tickets across sixty departments could count what was on the floor, at retail, because the price was printed on the tag. What it could not do was look up the invoice cost of every one of those items. So the method inverts the problem: count at retail, which is easy, then convert to cost using a ratio derived from the period’s purchases.
That origin explains its shape. It is a conversion tool, not a measurement tool. Everything it produces is an estimate whose quality depends entirely on whether the ratio you applied resembles the actual cost structure of the goods you have left.
Modern systems have removed the original constraint. Any competent inventory system holds unit cost at the SKU. That is exactly why the method is now a live question rather than a settled default, and why two of the most recognisable names in American retail have walked away from it while most of their peers have not.
The three variants, and who uses which
Conventional retail, also called the LCM variant, includes net markups in the retail denominator and excludes net markdowns. The logic is deliberate rather than sloppy. Ignoring the price reductions you have already taken keeps the ratio anchored to the original intended margin, which makes the resulting ratio lower and the resulting inventory value lower. That understatement is the point: it approximates lower of cost or market without requiring a separate market test. This is the variant most department stores historically ran and the one auditors are most comfortable with.
Average cost retail includes both markups and markdowns. The ratio rises, and the valuation moves closer to what the goods are actually worth given the prices you are actually charging. It is the more economically honest number and the less conservative one. Retailers with disciplined, infrequent markdowns tend to prefer it because the conservatism of the conventional variant buys them very little.
FIFO retail includes markups and markdowns and excludes beginning inventory from both sides of the ratio. It values what is left using only this period’s cost structure. When acquisition costs have moved during the period, and in an inflationary stretch they always have, blending in last period’s costs produces a ratio that describes neither period well. FIFO retail is the answer to that specific problem.
The tempting conclusion is that one of these is correct and the others are approximations. That is not how it works. All three are accepted, all three are internally consistent, and the difference between them on the same set of inputs is not a rounding artifact. Running one quarter of a mid-sized store through all three, the retail inventory method calculator returns $94,615 under conventional, $100,408 under average cost and $102,353 under FIFO retail. The spread between the extremes is 8.2 percent of the asset. The one-page cheat sheet sets the three denominators side by side if you want the comparison next to a keyboard rather than in a browser tab.
The number moves most when you are least able to think about it
Here is the property that makes the variant choice operationally interesting rather than merely academic: the variants converge in quiet quarters and diverge in loud ones.
Markdowns are the only input that behaves differently across the three, so the size of the disagreement scales with markdown intensity. In a quarter with $60,000 of markdowns, the conventional and average cost variants differed by $5,793 in the worked example on the calculator page. Push markdowns to $150,000, hold everything else constant, and the gap widens to $15,946 on the same $160,000 of ending inventory at retail. The conventional figure does not move at all, because markdowns never entered its ratio.
So the accounting policy question gets loudest precisely during a clearance event, a bad season, or a liquidation of aged stock. Those are the quarters when the finance team is busiest and least inclined to reopen a methodology decision made years ago. The practical advice is to know which variant you run before you need to, and to know how it behaves when markdowns spike. The mechanics of markdown accounting itself, including the difference between a permanent markdown and a promotional reduction, are covered in markdown pricing explained, and the distinction matters here because only permanent markdowns should hit the ratio.
The mistake that costs more than the variant choice
Choosing the wrong variant will move your inventory value by a few percentage points. Running a single blended ratio across departments with different margins can move it by a third.
The mechanism is worth stating plainly, because it is not intuitive. A blended cost-to-retail ratio is a weighted average of your departments, weighted by what you purchased. When you apply it to ending inventory, you are assuming your leftovers are distributed the same way your purchases were. They never are. Fast-selling departments leave less behind by definition, so the ending balance is always over-weighted toward whatever did not sell. If what did not sell is your low-margin, high-cost-complement department, the blended ratio will value your remaining inventory as though it carries the store’s average margin, which it does not.
In the two-department example on the calculator page, apparel at a 50 percent cost complement cleared through the quarter while consumer electronics at an 89.58 percent cost complement did not. The blended ratio valued ending inventory at $94,615. Departmental ratios valued the same inventory at $137,000. The blended approach understated the asset by $42,385, which is 30.9 percent of the correct figure, and it did so while returning a number that looked entirely reasonable.
That is the failure mode to worry about. A wrong variant produces a defensible number. A blended ratio applied to a skewed mix produces a wrong number that nobody questions. The fix is to run the ratio at the department or class level and sum the results, which is a spreadsheet problem rather than a systems problem, and it is why the accompanying Excel worksheet has a departmental tab rather than a single input block.
Departments are the minimum granularity. Classes are better where the margin spread within a department is wide, which is common in home, hardlines and anywhere a single department mixes commodity and premium price points. The trade-off is real: more granularity means more input discipline, and a departmental ratio built on sloppy purchase coding is worse than a clean blended one.
What the method tells you about shrink, and what it does not
Because ending inventory at retail is derived arithmetically, the method assumes every unit is either sold or still there. The gap between that book figure and a physical count is shrink at retail, and multiplying it by the cost complement converts it to cost.
This is how most retailers actually quantify shrink, and it is the reason the retail method survives in organisations that have long since had the systems to abandon it. It gives you a shrink number as a by-product, denominated correctly, without any additional work. The shrinkage guide covers what to do with that number operationally.
What it cannot do is find shrink on its own. Without a count you have an estimate that drifts in one direction: unrecorded losses stay inside ending inventory, which overstates both the asset and the gross margin, quarter after quarter, until a count forces the whole correction into a single period. That is the classic pattern behind a surprise inventory writedown, and it is almost always a counting cadence failure rather than an accounting failure. Retailers running cycle counts surface the variance in small pieces. Retailers counting annually surface it as an incident.
Why two large retailers left and most stayed
Supply Chain Dive reported on 19 December 2024 that Macy’s had fully converted from the retail method to cost accounting, an announcement its CFO Adrian Mitchell made in February 2024, and that Nordstrom’s CFO Cathy Smith said in March 2024 that her company would transition as of that fiscal year. The same report listed Dillard’s, Target, Walmart, Kohl’s, J.C. Penney and Dollar Tree as still using it, and cited PwC for the finding that nearly a third of the NRF top 100 still use the retail method to some extent, about a quarter of them using only the retail method.
The split is not random. Read the list and the pattern is markdown intensity. The two that left are department stores, the format that discounts most aggressively and most continuously, and therefore the format where the conventional variant’s blindness to markdowns creates the widest gap between book value and economic value. The ones that stayed skew toward grocery, discount and mass, formats with lighter and more predictable markdown activity, where the method’s estimate stays close to reality and the cost of switching buys very little.
Which is the honest way to read the whole debate. The retail method has not been discredited. It has been outgrown by a specific kind of retailer, for a specific and identifiable reason.
When to stop using it
Four signals, roughly in order of how often they turn out to be decisive.
- Your markdown rate has structurally risen. Not one bad season. A sustained shift in how much of your volume clears at reduced price. That is the Macy’s case, and it is the strongest reason to move.
- Your margin spread across departments is wide and your mix is volatile. Departmental ratios mitigate this, but past a certain complexity you are maintaining a parallel cost system inside a retail-method framework and getting the worst of both.
- Your systems already hold reliable unit cost at the SKU. The original constraint is gone. If cost accounting is a reporting change rather than a data collection project, the main argument for staying is inertia.
- You are making decisions the method cannot support. Item-level profitability, vendor negotiation, and anything that feeds GMROI or inventory turnover analysis at a granular level all want actual cost, not an estimated cost complement.
Against all of that: the retail method is cheap, fast, produces a shrink figure for free, and is well understood by every auditor you will ever meet. Those are not trivial advantages, and close to a third of the largest retailers in the country have weighed them and stayed. If you are running it, the useful work is not agonising over whether to leave. It is making sure you know which variant you use, that you apply it consistently, and that you are not running one blended ratio across departments that have nothing in common.
Frequently Asked Questions
How often should the cost-to-retail ratio be recalculated?+
Every reporting period, using that period’s purchases. A ratio carried forward from a prior period describes a cost structure you no longer have, and the error compounds quietly. Retailers on monthly reporting should rebuild it monthly.
Can two retailers with identical inventory report different values for it?+
Yes, legitimately. Different variants, different departmental granularity and different markdown timing will all produce different carrying values from the same physical stock. This is one reason inventory turnover comparisons between retailers on different methods deserve scepticism.
Where should a vendor allowance or rebate be posted?+
Against cost, which lowers the numerator and lowers the ratio. Posting it as additional retail is a common error and inflates the denominator instead, pushing the ratio down for the wrong reason and corrupting the margin implied by the cost complement. The gross margin vs markup guide covers the adjacent conversions where this tends to go wrong.
Should transfers between stores affect the calculation?+
They affect both columns at the sending and receiving location and net to zero for the chain. At store level they must be captured at both cost and retail or the store’s ratio drifts. Chains that only track transfers at retail end up with store-level ratios that cannot be reconciled to the consolidated figure.
Which departments benefit most from their own ratio?+
Any department whose margin sits far from the store average, and any department whose sell-through pattern differs sharply from the rest of the store. Seasonal categories qualify on both counts, which is why they are the usual place a blended ratio does its worst damage. Inventory aging analysis is a reasonable way to find the departments where leftovers are accumulating.
What breaks first when the retail method is implemented badly?+
The retail column. Cost is disciplined by invoices, so it tends to be accurate. Retail depends on someone recording every permanent price change as a markup or markdown, and that discipline decays first at store level. Once the retail column is unreliable, every downstream figure including shrink is unreliable, and the failure is invisible because the arithmetic still works.
Is the retail method suitable for a single-store independent retailer?+
It can be, if the store prices consistently and has a small number of margin tiers. Below a certain size, though, the effort of maintaining two parallel columns often exceeds the effort of just tracking cost directly, particularly for a store already running a POS that holds cost at the SKU.
Does the method work for retailers with heavy online discounting?+
Less well, for the same reason it works less well for department stores. Continuous promotional pricing across channels makes the markdown figure large, volatile and harder to classify, and every one of those properties widens the gap between the variants and weakens the estimate.
Related Calculators
Try the math from this guide with our free tools.
Retail Inventory Method Calculator
In February 2024, Macy’s CFO Adrian Mitchell told investors the company had fully converted from the retail inventory method to cost accounting. A month later, Nordstrom’s CFO Cathy Smith said her company would transition as of that fiscal year. Supply Chain Dive, reporting on the shift on 19 December 2024, listed the large retailers who stayed put: Dillard’s, Target, Walmart, Kohl’s, J.C. Penney and Dollar Tree. Citing PwC, the same report noted that nearly a third of the National Retail Federation’s top 100 still use the retail method to some extent, about a quarter of them using only the retail method and the rest running a hybrid. So the method is not obsolete and it is not unimpeachable. It is a working estimate with one known distortion, and that distortion lives almost entirely inside a single decision most operators make without noticing they have made it: whether net markdowns belong in the denominator of the cost-to-retail ratio. That one choice moved the answer by 6.1 percent in the worked example below, on identical inputs. In a heavy clearance quarter it moved it by nearly 17 percent. This calculator runs all three standard variants at once so the choice is visible rather than buried in a spreadsheet someone inherited.
Open calculator
Inventory Turnover Calculator
Measure how many times a year your average inventory sells through and gets replaced. The single most consequential operational KPI in retail. It connects buying decisions, warehouse cash, markdown risk, and finance targets into one number. The turn ratio arrives converted into days and weeks of supply, together with the working capital a one-turn improvement would release. Departments that carry stock at retail value rather than cost usually track it with a retail inventory method tracking template, which produces the same average-inventory figure this calculator needs.
Open calculator
Gross Margin Calculator
The cleanest read on how much of every sales dollar you actually keep after paying for the goods. Gross margin drives every downstream financial decision in retail: what to price, what to promote, what to keep on the shelf. Margin percent, the markup equivalent, cost as a percent of revenue and the price-to-cost multiplier all appear together, which is what it takes to translate between the three lenses without reaching for a second tool. The COGS input behind all of it depends on how inventory is valued in the first place, and a retailer using the retail inventory method will get a different COGS figure than one costing at actual unit cost, even from identical sales and purchase data.
Open calculator
GMROI Calculator
The single most honest cross-category profitability metric in retail. GMROI answers one question: for every dollar of inventory you funded, how many dollars of gross profit did you get back? A high gross margin on inventory that never sells produces zero return, which is why GMROI keeps margin and inventory turnover honest against each other. The output is the GMROI ratio with gross margin percent, inventory turnover, gross profit and a plain-English performance band, because the ratio on its own tells a buyer very little.
Open calculator
Markdown Calculator
The pricing tool every buyer and merchandiser reaches for when inventory is running behind sell-through pace. Out comes the markdown amount, the markdown percent, the final selling price, and, once a cost is entered, the resulting gross profit and margin percent. It also flags whether the markdown depth is promotional, seasonal, aggressive or clearance-tier, and generates practical next-step recommendations tied to gross margin, GMROI, sell-through rate and inventory turnover. A markdown also changes the inventory value carried under the retail inventory method, so it is worth re-checking that ratio after a significant markdown event rather than waiting for the next period close.
Open calculator
Markup Calculator
Set a selling price from cost or reverse-engineer the markup baked into an existing price. Markup is the buyer’s language of pricing (percent added on top of cost), while margin is the finance language (percent kept from revenue). Alongside markup percent come profit per unit, the margin equivalent and the price-to-cost multiplier. Buying and finance can then argue about the price rather than about the denominator. Departments already running the retail inventory method calculator have a cost-to-retail ratio on hand, which doubles as a fast sanity check against the markup this page returns.
Open calculator
Related Articles
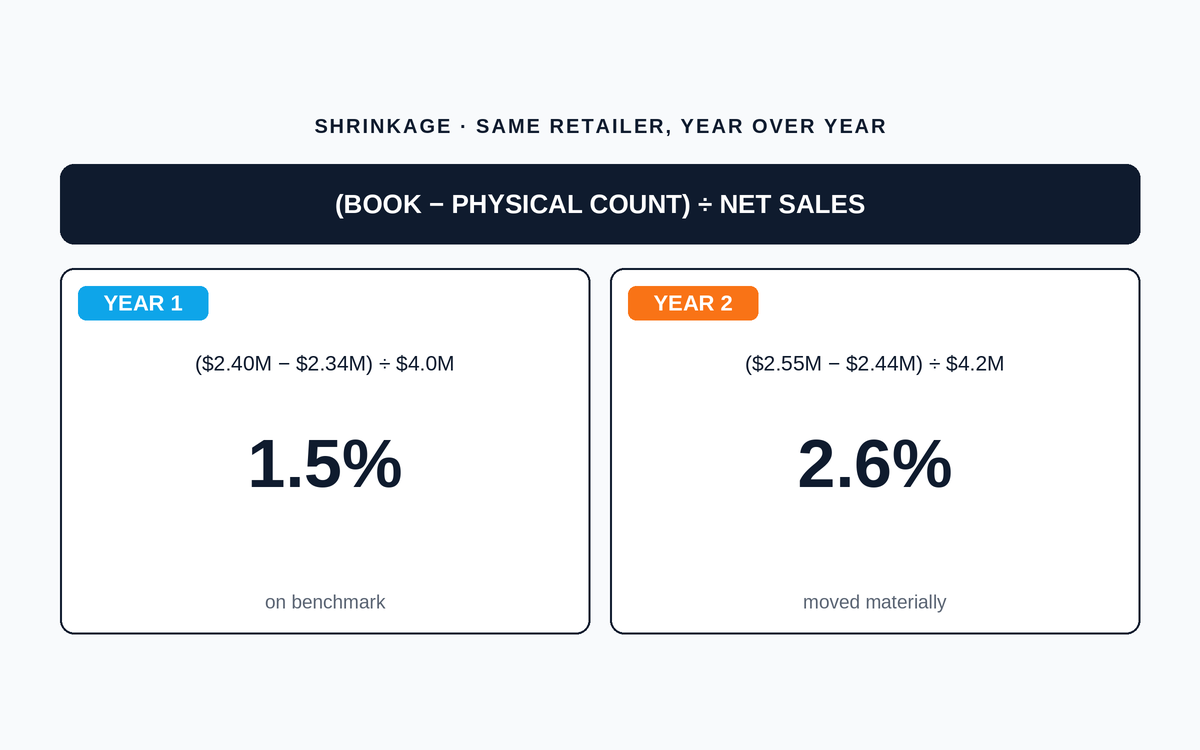
Retail Shrinkage: How to Measure It, Where the Losses Sit, and Ten Tactics That Actually Work
How to measure shrink honestly, the four root causes and their real weights, ten tactics ranked by dollar recovery per program dollar, the self-checkout question, and the culture pattern that separates operators who beat their category benchmark from operators who explain their number every quarter.
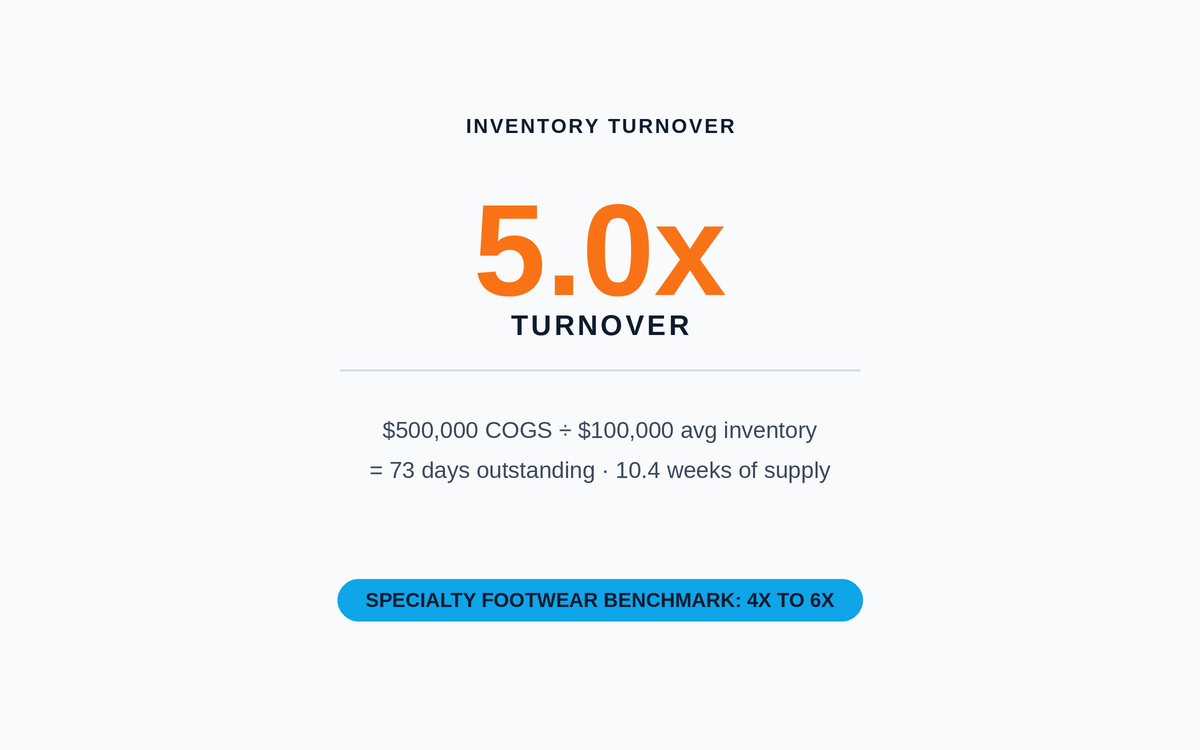
Inventory Turnover Explained: Formula, Benchmarks and How to Actually Move It
How retail operators actually work the turnover ratio. The formula, the cost-versus-sales trap, three what-if scenarios, category benchmarks, the seven levers that move turn, and the guardrails that keep higher turn from becoming lost sales.
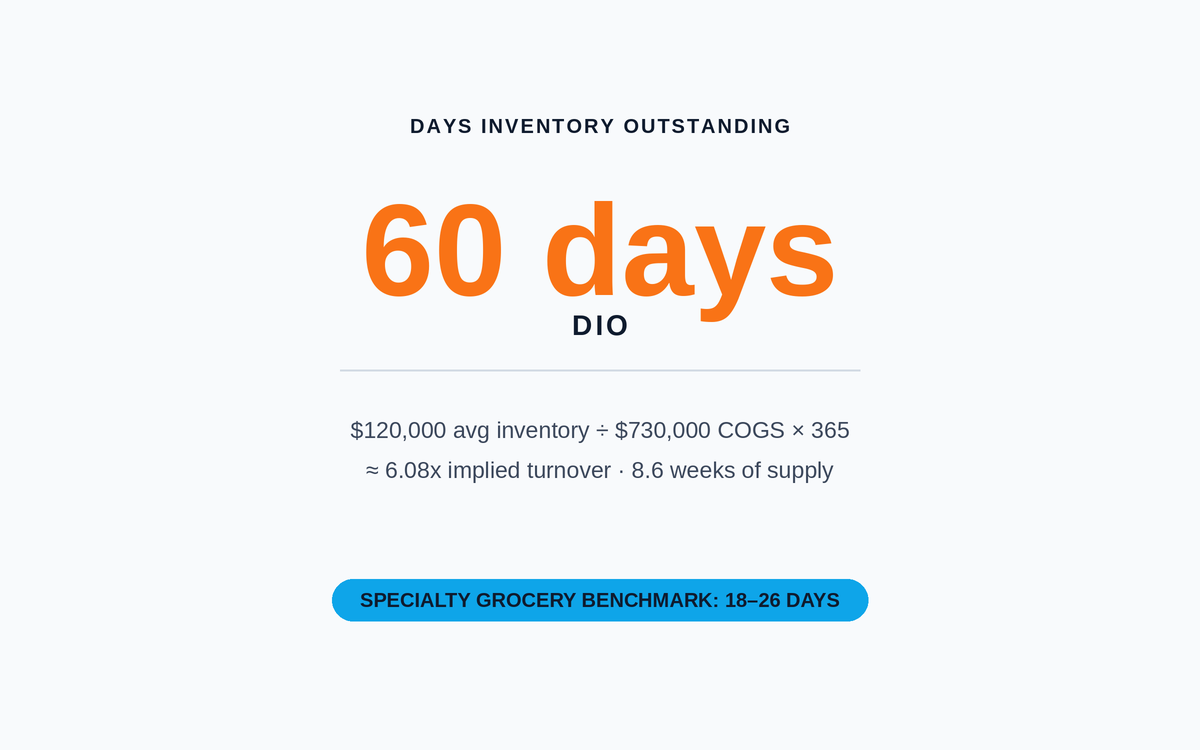
Days Inventory Outstanding (DIO) Explained: The Cash-Focused View of Inventory
How buyers and finance actually work Days Inventory Outstanding. The formula, three what-if scenarios showing exactly how much cash a 10-day DIO improvement releases, category benchmarks, cash conversion cycle context, and the levers that shrink DIO on purpose.
Explore Related Resources
Handpicked benchmarks, templates and guides to help you dig deeper.