Retail POS Systems: A Buyer’s Guide for Operators (Cloud vs On-Prem, Mobile POS, Total Cost of Ownership)
The POS is not a checkout appliance, it is the operating system of the physical store. What a modern retail POS actually does, seven capabilities that separate a legacy terminal from a modern platform, cloud vs on-prem with a worked five-year TCO, where mobile POS wins and loses, and the six pitfalls that turn reasonable RFPs into year-two regrets.

Table of contents+
Ask a retail CFO what the POS does, and the answer is almost always some version of “it rings up sales.” The answer is technically correct and strategically incomplete. The POS is the operating system of a physical retail business. Every unit of inventory that leaves the store passes through it. Every customer identification, loyalty enrollment, promotional application and payment authorization passes through it. Every data feed that finance, merchandising, marketing and supply chain depend on originates at that terminal. When a POS decision is made purely on transaction speed and price per lane, the retailer is optimizing about 5 percent of what the system actually does and ignoring the 95 percent that determines whether the next five years of digital investment will work.
This buyer’s guide sits inside that reframing. What follows: what a modern retail POS actually does in operator terms, the seven capabilities that separate a modern platform from a legacy terminal, the cloud-versus-on-premise question in 2026 with a worked total-cost-of-ownership comparison, the mobile POS trade-off, total cost of ownership beyond the sticker price, and the six pitfalls that make otherwise well-run POS RFPs deliver disappointing results.
What a modern retail POS actually does
A modern retail POS is four systems in one physical footprint. First, a transaction engine that processes the sale, applies pricing rules, calculates tax and completes payment. Second, an inventory decrement engine that adjusts perpetual inventory in real time and pushes those adjustments to the merchandising system. Third, a customer identification and loyalty engine that ties every basket back to a known customer where possible and applies personalized promotions. Fourth, a data collection layer that streams basket, SKU, price, promotion, customer, employee and time data to the analytics stack for finance, merchandising, marketing and supply chain to consume.
The last of the four is where most legacy POS decisions age badly. A transaction engine that runs fast but does not stream clean, real-time, structured data to the analytics stack forces every downstream team to build brittle workarounds. Retailers who bought POS on transaction speed alone in the mid-2010s spent the next decade running batch reconciliation jobs instead of live dashboards. The 2026 buying criterion is not which system rings up fastest; it is which system delivers the cleanest data plane to the rest of the technology stack. Metrics like inventory turnover and sell-through become leading indicators only when the POS feeds them clean, real-time data.
The seven capabilities that separate legacy from modern
Seven capabilities separate a modern retail POS from a legacy terminal in 2026. Any RFP that does not score all seven at demo stage is buying on price rather than platform.
1. Real-time inventory decrement with SKU-level accuracy
Every sale must decrement the perpetual inventory record within seconds, not overnight. Retailers running overnight batch decrement systematically overstate available inventory during the day, oversell online orders against store stock, and drift out of accuracy inside a single quarter. Cross-check with the retail shrinkage guide: real-time decrement is a precondition for meaningful shrink measurement.
2. Omnichannel order management
The POS must handle buy-online-pickup-in-store, ship-from-store, endless-aisle order placement and cross-store transfers as first-class transaction types, not as bolt-on modules. A retailer whose store associates cannot ring up a shipped-to-home purchase from the same terminal that runs the register is running two disconnected commerce systems.
3. Integrated payment processing with processor portability
Bundled payment processing is convenient at signature but expensive over time. Insist on processor portability: the retailer must be able to switch payment processors without replacing the POS. Bundled processors that lock the retailer in typically run 20 to 40 basis points more expensive than best-in-class independent processors, which is $200K to $400K of pure margin per $100M of card volume.
4. Open APIs and event streaming
Every capability the POS offers must also be accessible via API. Every transaction must emit an event that downstream systems can subscribe to. POS platforms that gatekeep API access behind expensive add-on tiers should be disqualified at the RFP stage. The retailer’s data plane will only be as clean as the POS lets it be.
5. Native mobile POS with fallback to fixed lanes
Modern retail POS platforms support handheld and fixed-lane modes on the same software stack. This matters both for peak-season line-busting and for hybrid store formats. Retailers running separate mobile POS and fixed POS stacks are running the same operations twice.
6. Offline mode with clean sync
Every store loses internet at some point. The POS must continue processing transactions offline (with a documented feature set of what is and is not available offline) and sync cleanly when connectivity returns. Test this explicitly in the vendor demo: unplug the network cable and run five different transaction types. Vendors that resist the test are hiding weak offline handling.
7. Role-based access control and full audit trail
Every action on the POS must be attributable to a specific employee, with configurable permissions and a tamper-resistant audit log. POS analytics for internal loss prevention depend on this being airtight. Systems that treat audit logs as a compliance afterthought fail the moment a serious loss investigation begins.
Cloud vs on-premise in 2026
The cloud-versus-on-premise question was contested through the early 2020s. It largely is not anymore. Cloud-native POS platforms (Shopify POS, Lightspeed Retail, Square for Retail, NCR Voyix cloud, Oracle Retail Xstore SaaS) have become the default for retailers under about 500 stores. On-premise still has a legitimate place at very large chain scale and in categories with hard offline requirements, but the burden of proof has shifted decisively.
A five-year total-cost-of-ownership example makes the trade explicit. A 50-store specialty retailer running on-premise POS: license fees $200K upfront, hardware refresh $180K across five years, on-premise servers $85K plus $40K/year support, in-house IT to maintain $220K/year. Five-year TCO: roughly $1.85M. The same retailer on cloud POS: SaaS subscription $18 per register per month across 200 registers = $216K/year, hardware refresh $220K across five years (cloud POS often needs slightly more capable devices), no server infrastructure, IT support reduced to $95K/year. Five-year TCO: roughly $1.72M. The cloud version is modestly cheaper on pure TCO and dramatically better on upgrade velocity, integration surface area and disaster recovery.
The on-premise case remains defensible in three situations. First, chains with more than 1,000 stores where per-register SaaS pricing grows uneconomic at scale. Second, retailers with strict data-residency or air-gapped compliance requirements. Third, formats with 30-plus-minute offline tolerance requirements where cloud sync friction is unacceptable. Outside of those three, cloud is the answer in 2026.
Mobile POS: where it wins, where it loses
Mobile POS is a format decision, not a technology decision. It works brilliantly in some retail formats and poorly in others, and the deciding factor is basket profile rather than POS software capability.
Mobile POS wins in specialty retail where each transaction is consultative, basket size is 1 to 4 items, and associate time is a selling asset. Apple, Aritzia, Bonobos, Warby Parker and most premium specialty formats have run mobile POS successfully for years. Sales-per-employee-hour and conversion both lift measurably; typical lifts are 8 to 15 percent on conversion during peak hours from queue elimination alone, which shows up as measurable improvement in sales per labor hour and hit-rate against the store-level sales target.
Mobile POS underperforms in grocery, dollar/discount and any format where basket sizes are 15 to 60 items. In these formats, fixed checkout with bagging area, weight verification and integrated payment terminals beats handheld devices decisively. Self-checkout is a better line-busting tool in high-basket-count formats than mobile POS. The pitfall is retailers who deploy mobile POS across formats where it does not fit because a vendor demo made it look universally applicable.
Rollout mistakes are consistent across retailers that struggle with mobile POS. Underspecified Wi-Fi coverage causes handhelds to lose payment authorization mid-transaction. Battery management gets treated as an afterthought and devices die during peak. Payment hardware selection prioritizes aesthetics over reliability. Every mobile POS rollout that fails at scale traces back to one of these three.
Total cost of ownership beyond the sticker
POS vendors quote per-register or per-store pricing. Neither number reflects true total cost of ownership. Six line items commonly get omitted from the sales-cycle price sheet and each one is meaningful.
Payment processing spread: the difference between the bundled processor rate and a best-in-class independent processor typically runs 20 to 40 basis points. On a $100M card-volume retailer, that is $200K to $400K per year of margin the POS choice is effectively taxing.
Integration development cost: every downstream system (ERP, CRM, e-commerce, analytics, WMS) needs an integration path to the POS. Legacy POS platforms often require custom middleware that costs $80K to $250K per integration. Modern API-first POS platforms make most integrations near-turnkey.
Training and change management: a mid-sized rollout runs 3 to 6 hours per store associate. On a 200-store chain with 15 associates per store, that is 9,000 to 18,000 labor hours. At $20/hour blended, $180K to $360K.
Hardware refresh cycles: POS terminals last 5 to 7 years. Handheld devices last 3 to 4. The refresh cost across a five-year window is often 40 to 60 percent of initial hardware cost.
PCI compliance overhead: annual PCI assessment, quarterly ASV scans, and cardholder data segregation architecture add $30K to $150K per year for mid-sized retailers.
Downtime cost: every hour of POS downtime in a peak day costs the retailer measurable sales. On a $500K/day store during holiday peak, one hour of downtime during peak trading windows (when hourly sales concentrate at roughly three times the daily average) is roughly $60K of lost revenue. Reliability is a P&L line item, not a vendor promise.
Sum these six and the true TCO of a POS decision is 30 to 60 percent higher than the vendor’s headline number. Score vendors against a five-year all-in TCO, not sticker price.
The six pitfalls that sink otherwise well-run RFPs
Six mistakes appear consistently in POS RFPs that deliver disappointing results.
Pitfall 1: Buying on transaction speed alone. Every modern POS is fast enough at the register. Speed is a floor requirement, not a differentiator, and treating it as the primary criterion causes buyers to under-evaluate the seven capabilities that actually matter.
Pitfall 2: Underestimating implementation timeline. Single-store implementations take 4 to 8 weeks including training. Chain rollouts of 50-plus stores take 6 to 18 months and often longer. Retailers who promise "live in Q3" on a 200-store rollout are compressing timelines that will slip and generate change orders.
Pitfall 3: Ignoring offline mode until go-live. Offline behavior must be tested at RFP demo, not discovered during the first internet outage in production. The demo should include the specific offline transaction types the retailer relies on: refunds, splits, gift-card redemption, tax overrides.
Pitfall 4: Payment processor lock-in. Once a POS is deployed, processor switching costs are substantial. Insist on portability language in the contract before signature.
Pitfall 5: Forgetting the reporting layer. POS vendors often show a beautiful transactional UI and a sparse analytics module. Analytics is where 60 percent of the operational value sits. Score reporting capability equal to transaction capability at RFP stage.
Pitfall 6: Underinvesting in front-line training. Training budgets get compressed to hit go-live. Under-trained associates use the wrong workflows, corrupt inventory data, and generate the reason-code shrink the retail shrinkage guide covers in detail. The training budget should be roughly 15 to 25 percent of the total implementation budget, and it is almost always the first thing cut.
The takeaway
The POS is not a checkout appliance. It is the operating system of the physical store and the data plane that every downstream analytic depends on. The retailers who make good POS decisions in 2026 evaluate for platform capabilities first (real-time inventory, omnichannel orders, open APIs, integrated payments with processor portability, native mobile support, robust offline mode, tight role-based controls), for total five-year cost second, and for transaction speed last. Cloud POS is the default for retailers under about 500 stores; on-premise remains defensible only in specific enterprise-scale or compliance-driven cases. Mobile POS is a format-specific decision, not a universal one. And the six pitfalls above absorb most of the disappointment that shows up in year two of an otherwise reasonable RFP process. A retailer who runs this evaluation cleanly ends up with a POS platform that supports the next five years of digital investment rather than blocking it, which is the actual return the POS decision either delivers or fails to deliver.
Frequently Asked Questions
How long does POS implementation actually take at scale?+
Single-store rollouts run 4 to 8 weeks including training. Multi-store rollouts of 20 to 50 stores run 4 to 9 months. Chain rollouts above 100 stores run 9 to 18 months and often longer, especially where legacy inventory data must be cleansed before cutover. Vendor claims of "live in one quarter" on chain scale should be treated skeptically.
Should we use POS-bundled payment processing?+
Rarely as a first choice. Bundled processing is convenient and often runs 20 to 40 basis points more expensive than a best-in-class independent processor. On a $100M card-volume retailer, that is $200K to $400K of annual margin. Insist on processor portability in the contract regardless of the launch-day decision, so the retailer can switch later without replacing the POS.
What is the right refresh cycle for POS hardware?+
Fixed lanes: 5 to 7 years. Handheld mobile devices: 3 to 4 years. Payment terminals: 5 years, but often forced sooner by PCI compliance changes. Budget refresh capex across the five-year TCO window rather than treating hardware as a one-time expense.
Does mobile POS actually eliminate the need for fixed checkout?+
In specialty retail with small baskets and consultative selling, largely yes. In grocery, dollar/discount and any high-basket-count format, no. Most successful deployments are hybrid: fixed lanes anchor the transaction flow, handhelds line-bust during peak and enable clienteling on the floor. Full mobile-only rollouts in high-basket formats have consistently underperformed.
How important is offline mode really?+
Critical. Every retail location loses internet at some point. The POS must continue processing sales, applying pricing rules and taking payment offline, with a clean sync when connectivity returns. Test explicitly at RFP demo. Vendors that dodge the offline demo are hiding weak offline handling.
Cloud POS or on-premise in 2026?+
Cloud for retailers under about 500 stores. Cloud avoids server infrastructure, upgrades faster, integrates cleaner and generally comes out modestly cheaper on 5-year TCO. On-premise remains defensible only at very large chain scale (per-register SaaS pricing becomes uneconomic), in strict data-residency or air-gapped compliance situations, or where extended offline tolerance is a hard requirement.
What does POS integration with inventory management actually require?+
Real-time (or near-real-time) inventory decrement at each sale, real-time inventory push from the IMS to the POS for available-to-sell display, and reconciliation logging for cycle-count adjustments. Legacy POS platforms often rely on overnight batch decrement, which breaks omnichannel availability and inventory accuracy inside a single quarter. Insist on event-driven, real-time integration as a hard requirement.
How much should training cost as a share of total implementation?+
Roughly 15 to 25 percent of the total implementation budget. Retailers who compress training to hit an aggressive go-live date consistently pay for it in inventory data corruption, higher process shrink, and reduced productivity at the register in the following two quarters.
What is the single biggest predictor of POS RFP success?+
Weighting the scorecard toward platform capabilities rather than transaction speed. Every modern POS is fast enough at the register. What differentiates a five-year winner from a five-year loser is API openness, event streaming, offline behavior, integration surface area and total cost of ownership. Retailers who score these heavily at RFP consistently end up with platforms that support the next five years of digital investment.
Does a POS decision affect shrinkage?+
Yes, meaningfully. POS exception reporting is one of the top-ranked shrinkage tactics in the retail shrinkage guide, and POS platforms without native exception dashboards force retailers to build them externally at meaningful cost. Real-time inventory decrement, clean audit trails, role-based access and scan-not-key enforcement are all POS-side capabilities that materially affect the shrink number.
Related Calculators
Try the math from this guide with our free tools.
Sales Target Calculator
A sales target built from a single top-down number ("we need 8 percent growth this year") tells a store manager nothing about what to actually do differently on Tuesday. A sales target built from traffic, conversion rate and average transaction value tells the manager exactly which lever to pull and by how much. Traffic, conversion rate and average transaction value produce the daily, weekly, monthly and annual targets, which keeps the target attached to the three levers a manager can actually move on Tuesday.
Open calculator
Productivity Calculator
Sales per labor hour (SPLH) is the most operationally actionable productivity metric in retail because it moves at the same weekly cadence store managers use to build schedules. Unlike sales per FTE, which is best suited to quarterly or annual comparisons, SPLH responds to the exact staffing decisions a manager makes for next week's schedule. It produces SPLH, and SPLH is what turns next week's schedule from a hunch into something you can check afterwards.
Open calculator
Gross Margin Calculator
The cleanest read on how much of every sales dollar you actually keep after paying for the goods. Gross margin drives every downstream financial decision in retail: what to price, what to promote, what to keep on the shelf. Margin percent, the markup equivalent, cost as a percent of revenue and the price-to-cost multiplier all appear together, which is what it takes to translate between the three lenses without reaching for a second tool. The COGS input behind all of it depends on how inventory is valued in the first place, and a retailer using the retail inventory method will get a different COGS figure than one costing at actual unit cost, even from identical sales and purchase data.
Open calculator
Sell-Through Rate Calculator
The speed-of-sale metric every buyer, planner and category manager reads before touching pricing or reorder decisions. Sell-through rate measures the percent of received units that actually sold across the measurement window. High sell-through means the buy is working. Low sell-through means the inventory is aging faster than expected and the markdown clock is running. Enter units sold and units received and the STR percent arrives next to remaining units, weekly sell rate, and projected weeks to both 80 percent and 100 percent sell-through, with a plain-English band saying whether the buy is on pace. The point of the band is to be acted on, not filed.
Open calculator
Inventory Turnover Calculator
Measure how many times a year your average inventory sells through and gets replaced. The single most consequential operational KPI in retail. It connects buying decisions, warehouse cash, markdown risk, and finance targets into one number. The turn ratio arrives converted into days and weeks of supply, together with the working capital a one-turn improvement would release. Departments that carry stock at retail value rather than cost usually track it with a retail inventory method tracking template, which produces the same average-inventory figure this calculator needs.
Open calculator
Related Articles
Retail ERP Selection: A Buyer’s Guide
Retail ERP selection guide: must-have modules, common pitfalls, and how to evaluate vendors.
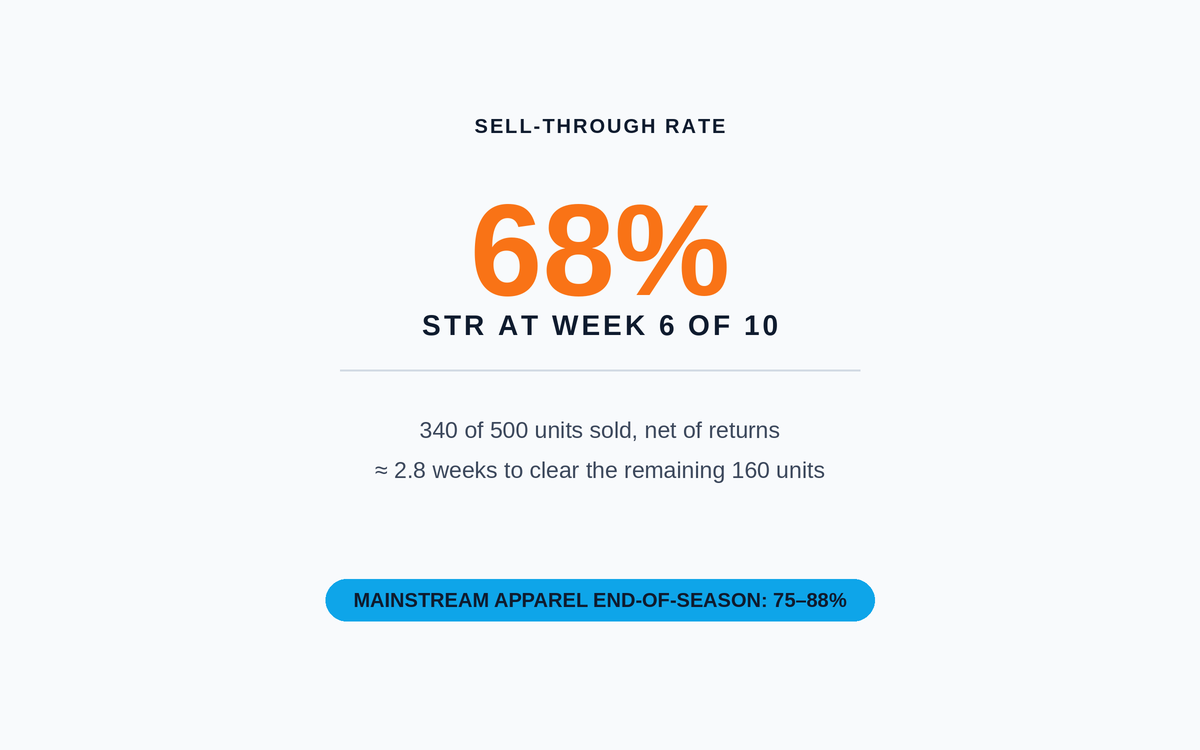
Sell-Through Rate Explained: The Buyer’s Speed-of-Sale Metric
The leading indicator every seasonal buyer reads weekly. How to compute STR the right way, plot it against a target curve, and use it to catch over-buying before it turns into aged inventory.
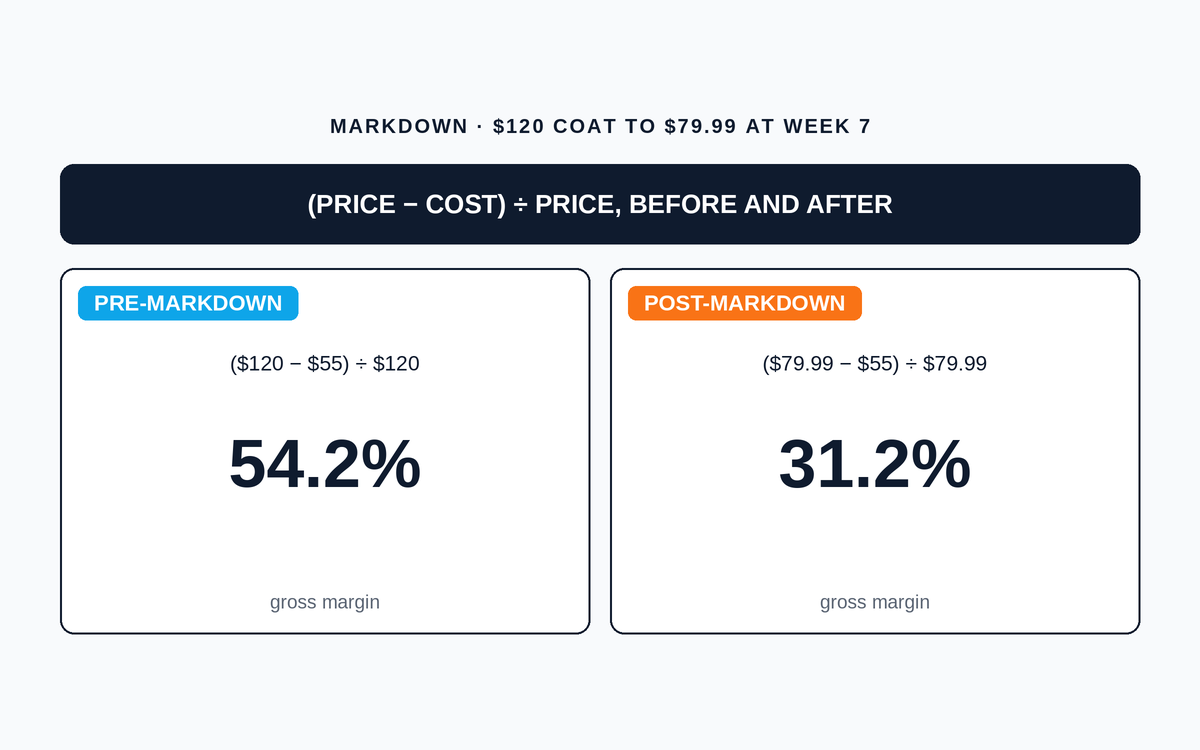
Markdown Pricing Explained: A Retail Operator’s Complete Guide
Everything a buyer, merchandiser or category manager needs to know about markdown pricing. When to trigger a markdown, how to size it, how it affects margin and GMROI, and the mistakes that quietly bleed working capital.
Explore Related Resources
Handpicked benchmarks, templates and guides to help you dig deeper.